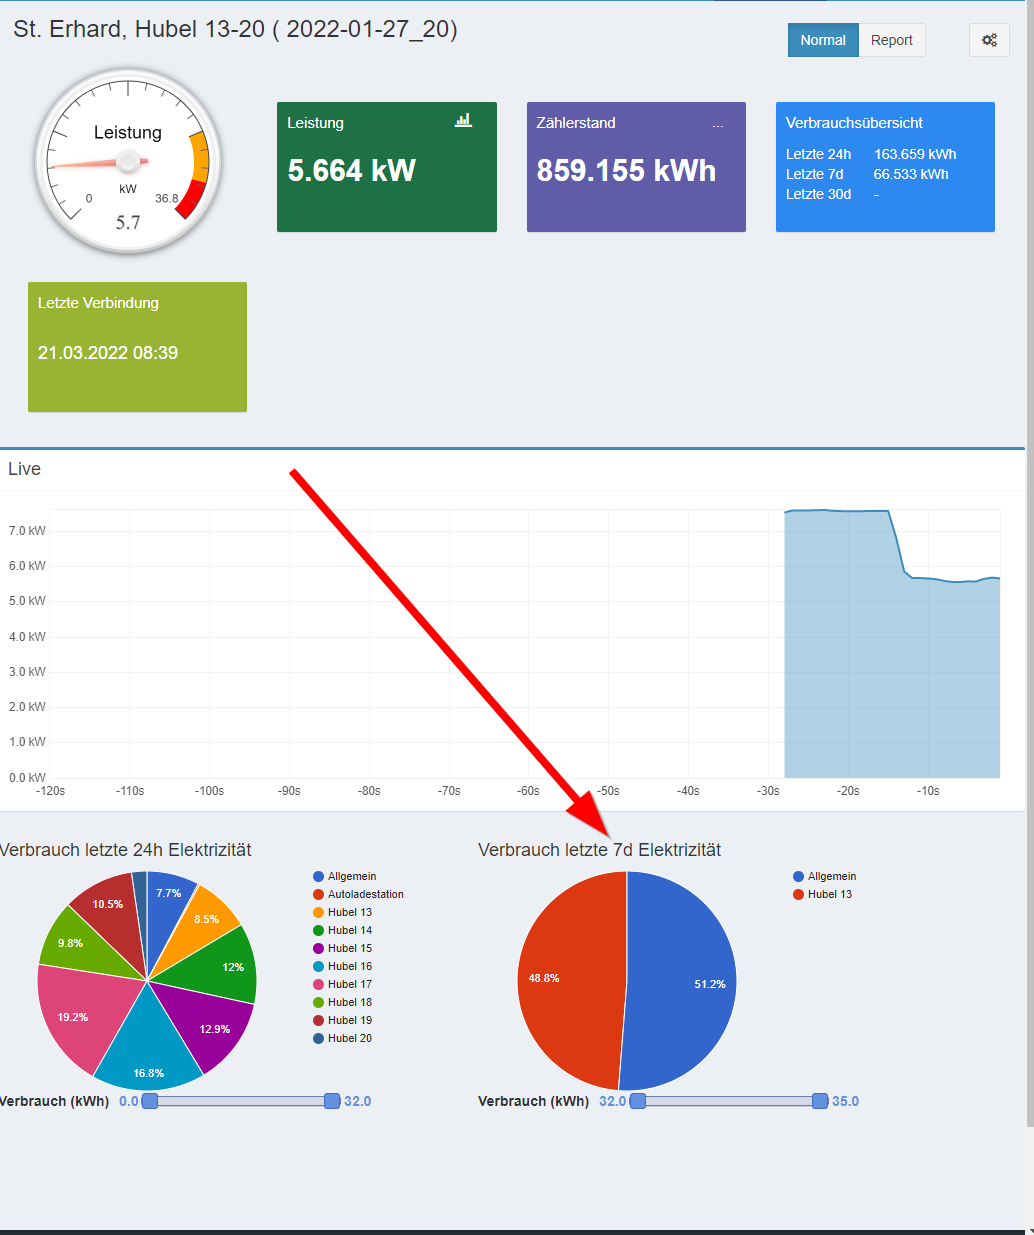
Visualization error
This section describes known error messages related to the visualizations and possible solutions.
The read-only user cannot see the energy flow.
Energy data is not displayed.
- Solution: Menu User Configuration (Benutzerkonfiguration) --> Make sure that the read-only user has access to the meters that generate the graphic. As a rule, these are the technical meters (balance and solar meters)
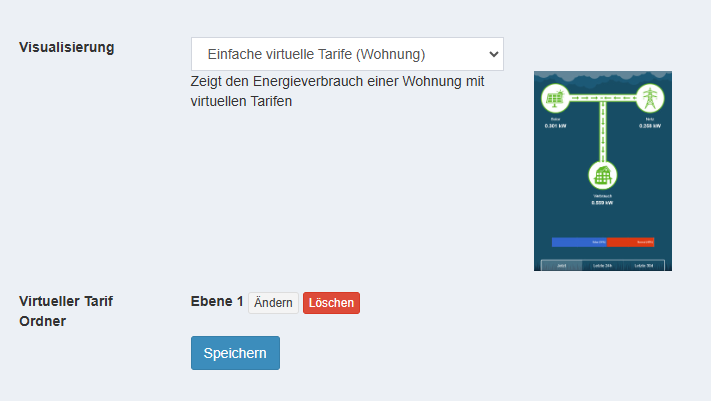
Simple virtual tariffs (apartment) (Einfache virtuelle Tarife (Wohnung)) is displayed empty
The display does not work or is displayed empty
-
Solution 1: Check in smart-me Billing that the calculation of the virtual tariffs (blue box) has no error. Billing error messages
-
Solution 2: Make sure that the folder of the apartment has been selected. If the meter is selected, it does not work.
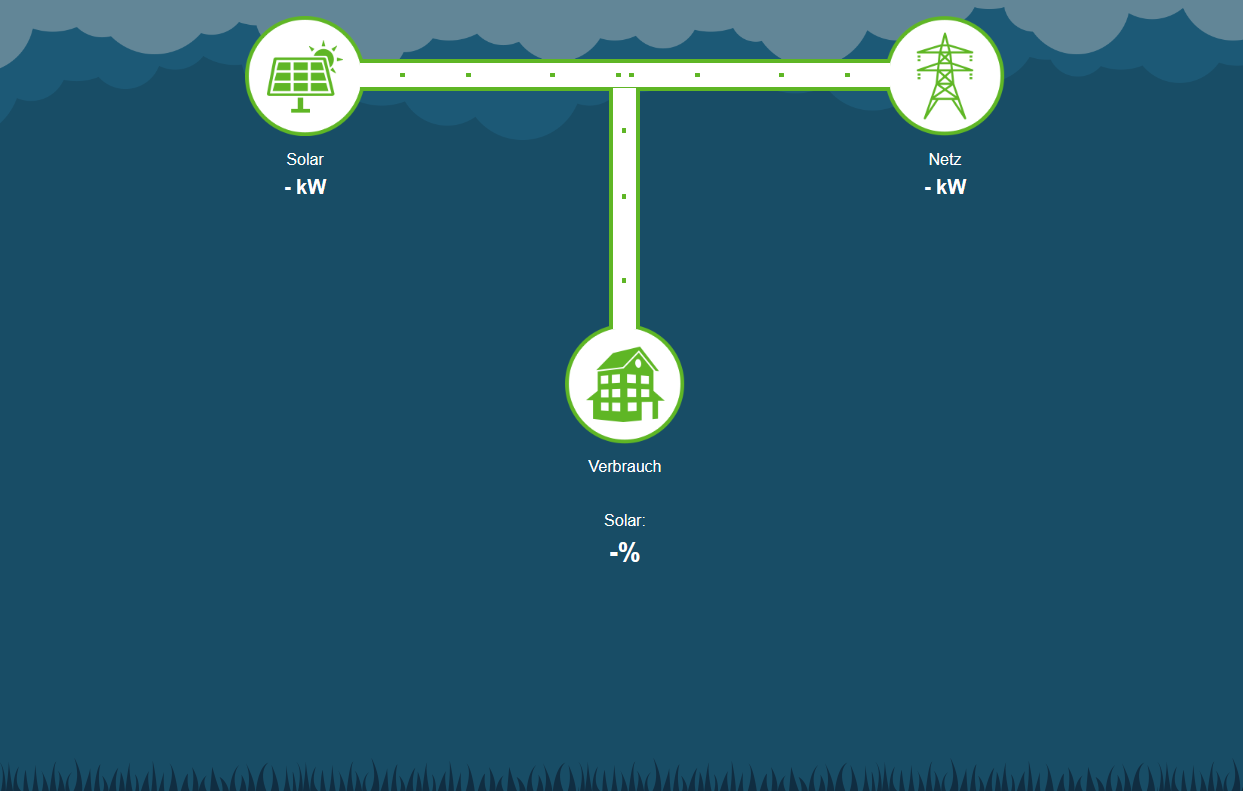
Simple energy flow
Values are not displayed correctly:
-
Solution 1: Make sure that only two of the three meters are stored in the configuration. If all three meters are specified, incorrect displays may occur. We always recommend specifying direct measurements wherever possible and not virtual meters
-
Solution 2: Check whether the meters are supplying the correct values.
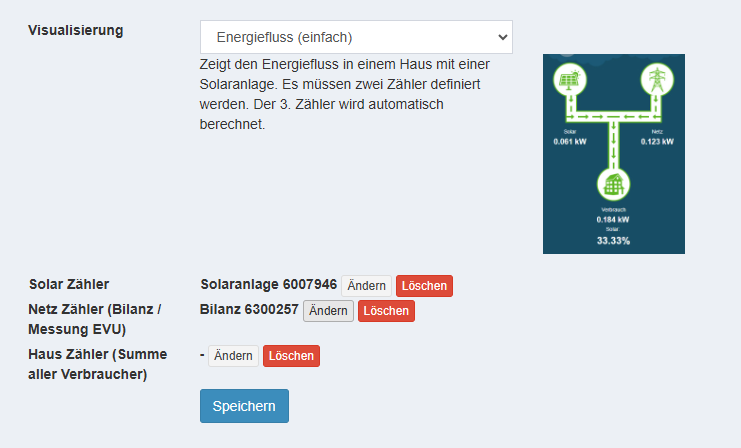
The PV meter was connected incorrectly. Now that it has been connected correctly, the graphic is no longer correct.
- Solution 1: The arrow in the graphic is determined by the meter reading. You simply have to wait until the meter reading is negative.

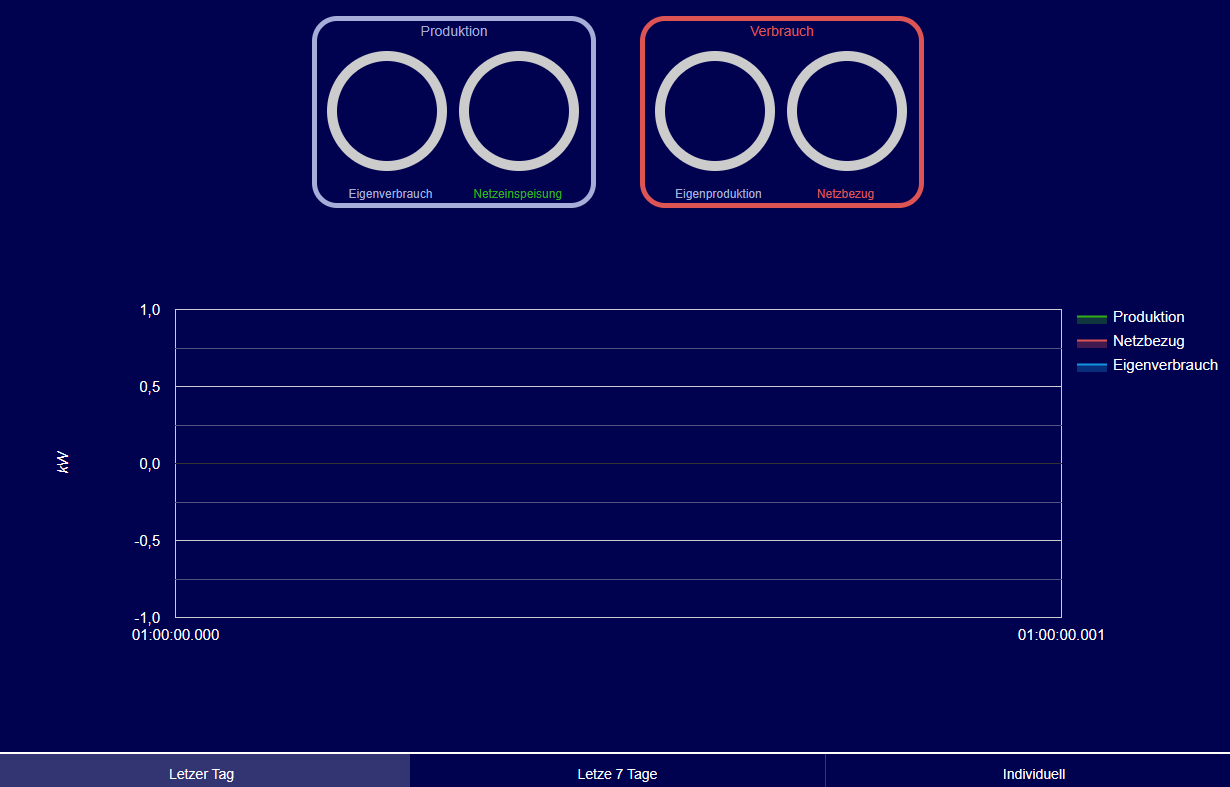
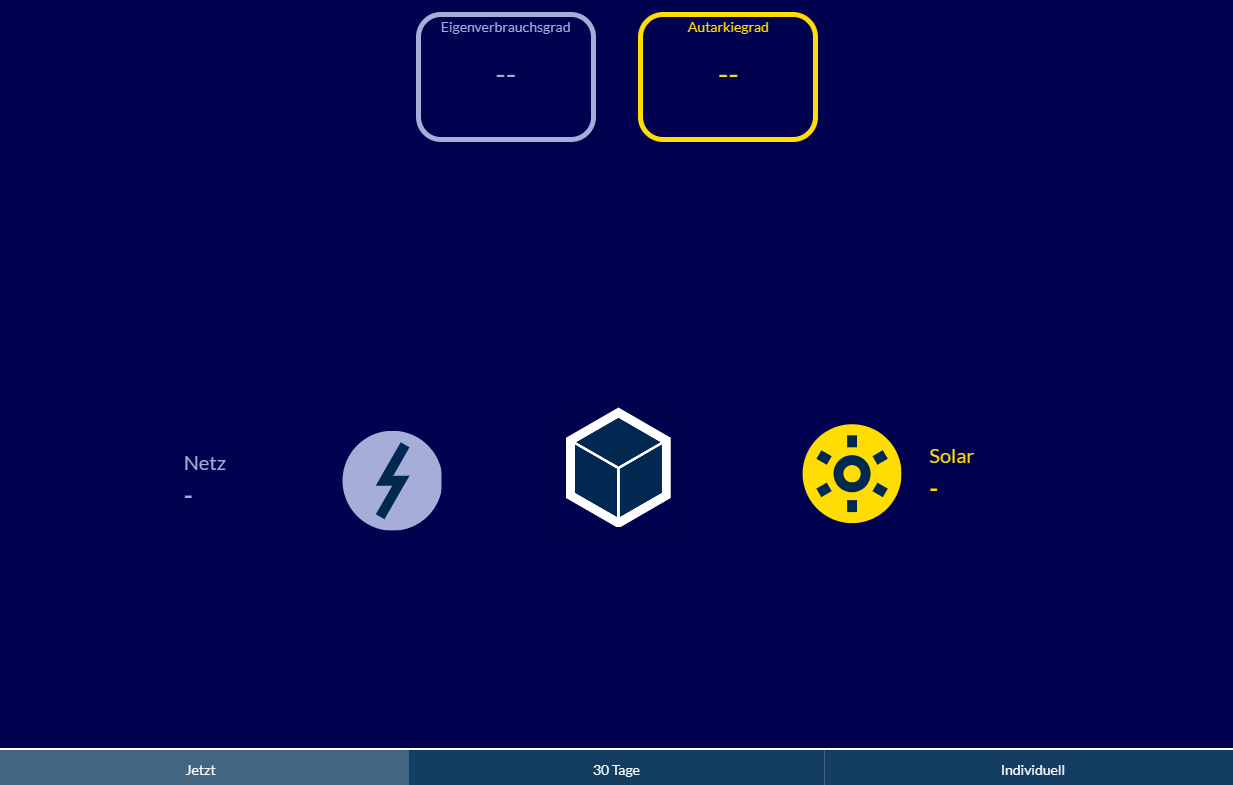
Consumption and production monitoring
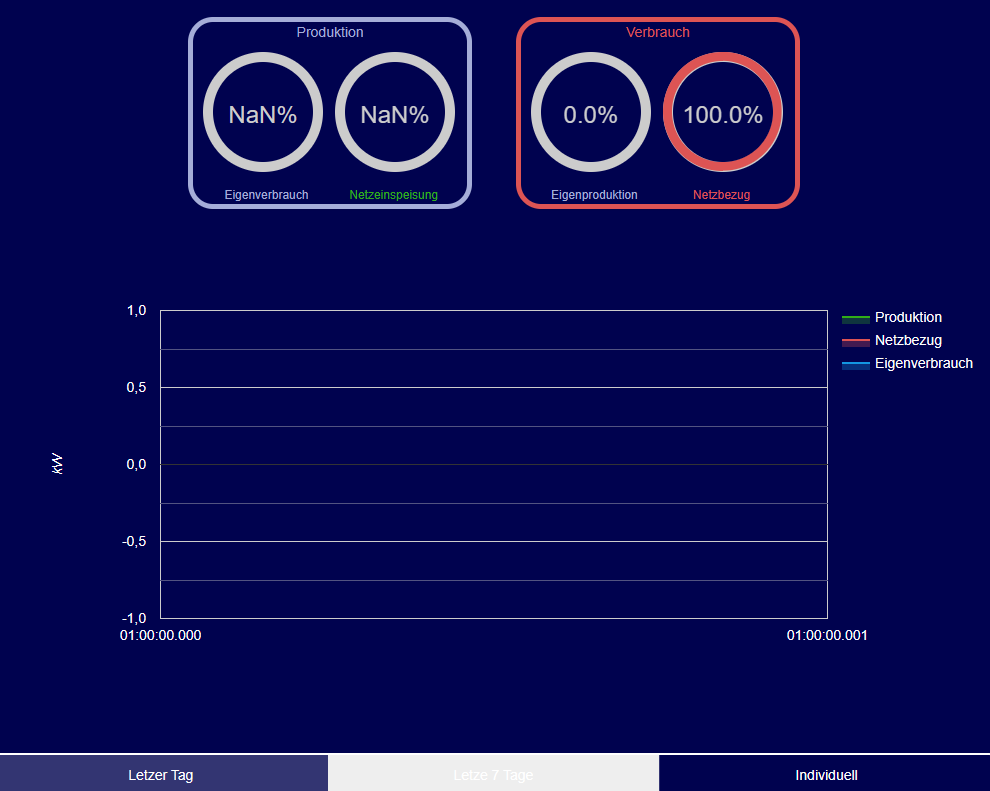
NaN% is displayed
- Solution 1: The solar meter has not produced anything yet on this day. Wait 24h or select the period "Custom" ("Individuell") so that the current day is displayed.
The pie chart does not show all meters
This happens when only some meters have been online for e.g. 7 days; then only these are displayed and the others not yet.