Telstar CT - Setup issues
This page describes common errors that can occur during the commissioning of the Telstar CT. It explains how to check and fix these errors.
Power does not match the utility meter.
Follow the steps below to troubleshoot the error.
1. Check the transformer ratio
Consider this approach mainly if the measured value is smaller by an integer factor (e.g. actual: 4W, expected: 240W (factor 60))
-
Solution: in the smart-me portal -> select the meter -> click the gear icon -> General Settings (Allgemeine Einstellungen) -> enter the ratio and save.
-
smart-me recommends setting the transformer ratio as stated on the transformer, e.g. 300A/5A --> 300:5
-
Important: Historical data is not adjusted.
2. Check whether the deviation between the utility meter and the smart-me meter is less than or equal to 2%.
Consider this approach mainly if the consumption values of the two meters are relatively close to each other.
Our devices have a measuring accuracy of 1% according to the MID standard. In addition, there is the deviation of the transformer of 0.5-1%. These deviations are permissible in accuracy class B. To determine the maximum permissible difference based on the permissible tolerances, the following rule of thumb can be applied.
Rule of thumb: maximum permissible difference [kWh] = utility meter energy * (measuring error Telstar CT in % + measuring error transformer in %)
Example: Utility meter: consumption 1000kWh Telstar CT: consumption 992kWh
maximum permissible difference [kWh] = utility meter energy * (measuring error Telstar CT in % + measuring error transformer in %) = 1000kWh * (0.01 + 0.01) = 20kWh
The measured value of the Telstar CT may lie within the range of 1000kWh +/- 20kWh; at 992kWh, this corresponds to the expected error.
Attention: Consumption depends on the measurement duration. For the above estimate, the same time period in which the energy was consumed must be selected for both meters. The meter reading on the utility meter does not necessarily have to be the same as that of the Telstar CT.
3. Check whether the terminals on the test terminal block are closed.
Consider this approach mainly if the power values are suspiciously low (half the expected power or less).
- In some projects, it is accidentally forgotten after installation to remove the short circuit on the test terminal block side. Unclosed terminals on the test terminal block still allow a small current flow, which is measured by the meter but does not correspond to the correct division ratio. (Parallel connection in the test terminal block to the measuring point in the meter)
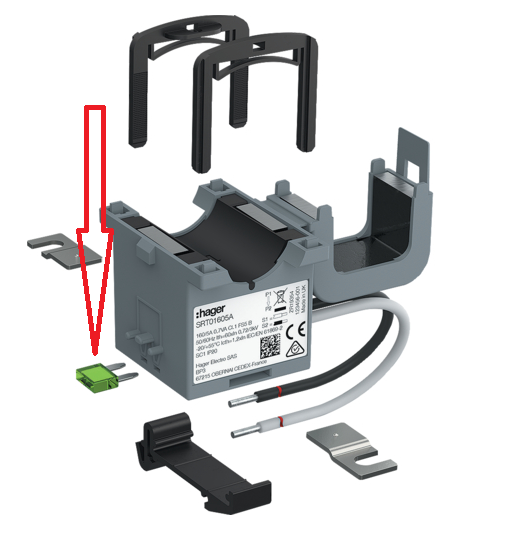
4. Check whether the transformer has a shorting link.
Consider this approach mainly if the power values are suspiciously low (half the expected power or less).
- Some transformers, such as the SRT01605A from Hager, are equipped with shorting links that must be removed after assembling and wiring the transformers, as described in the operating instructions.
5. Check the flow direction of the current transformers.
This approach is mainly pursued if phase power values are negative even though this is not expected.
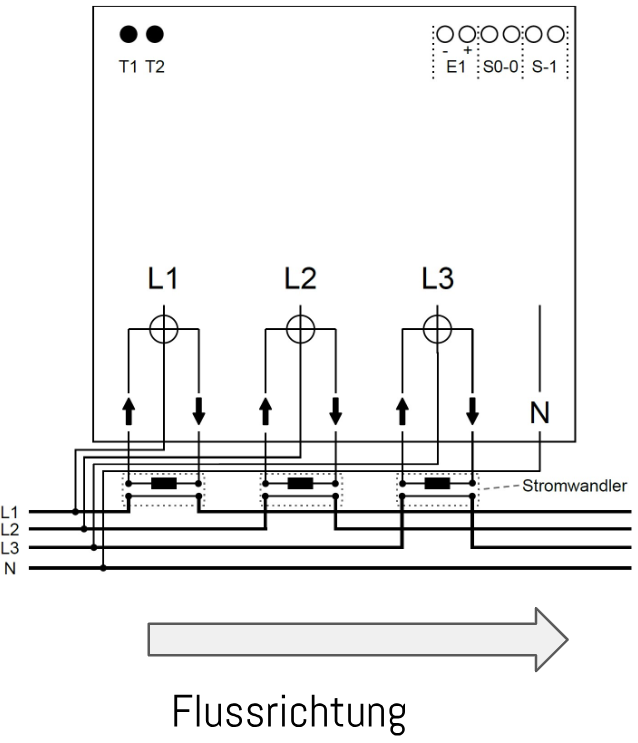
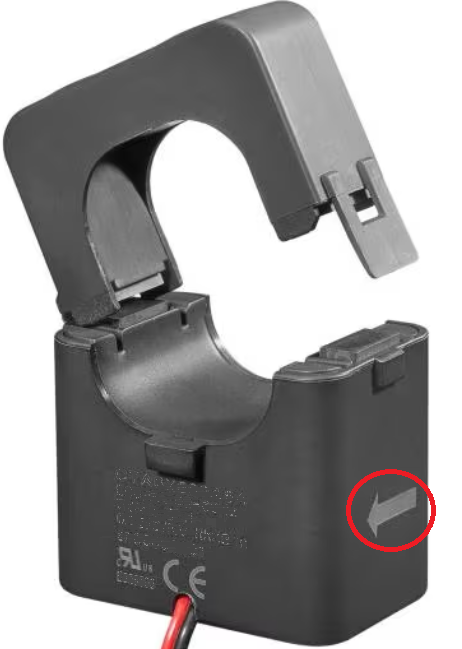
All transformers have a flow direction, which is marked with an arrow.
- The arrowhead always points towards:
-
Consumers and storage: apartments, e-mobility, heating systems and batteries
-
Producers: solar inverters and generators
The back of the arrow (flat) always points towards:
- Grid: grid connection, distribution or house distribution board
- The transformer positive of the respective phase is connected to input "I IN" and the transformer negative to "I OUT".
What corresponds to expectations:
-
On the PV meter, you must see negative currents and power values during production.
If there is no active production at the moment, there are usually positive currents and power values. (However, this situation is not unambiguous)
-
Pure consumption meters have exclusively positive signs for currents and power values.
-
The balance meter can show different signs per phase depending on the situation.
-
When purchasing, these are normally positive (solar system OFF for testing)
-
When feeding in, these are normally negative (solar system ON for testing, deviations on individual phases are possible)
-
However, the total power of the balance must correspond to production + consumption.
(Check via the load profile or via the visualization "Energy Flow Simple" ("Energiefluss Einfach"). Assign only the PV meter and total consumption to calculate the balance artificially, then compare the values in the visualization with the active power of the balance meter)
-
6. Check the phase shifts using the cos phi value per phase
If the cos phi value of several phases is consistently below 0.5, a phase voltage may have been swapped.
The meter then measures the voltage of L1 on input U phase 1, but I IN and I OUT of phase 1 measure the current of L2.
Note: If one phase is swapped, two phases are always swapped at once!
This leads to cos phi values around 0 to 0.6 (tending below 0.5)
-
Check all voltage and current connections for correct wiring.
-
Check the flow direction of the transformers
If these figures look good and are all well above 0.5, and you have worked through all previous steps, the only remaining option is to check the reactive power registers. This covers multiple swaps of flow directions and connections.

7. Check the reactive power registers of the meter
If the measured values still seem implausible, voltage taps and current measurement may have been swapped. The reactive power registers can give us an indication of this.
Suppose that two phase voltages were connected to the wrong inputs and, in addition, individual transformers were connected in the wrong flow direction: analysis based on active power data then becomes very difficult or almost impossible.
To display these reactive energy registers, the measurement must be activated. Activating reactive energy measurement: select the meter --> Hardware configuration (Hardwarekonfiguration) (gear icons) --> General Settings (Allgemeine Einstellungen) --> Activate reactive energy (Blindenergie aktivieren) (Yes (Ja))
When looking at a single-family/multi-family house with a solar system, the order of the meter readings of the quadrants should look like this in most cases:
-
Q1: Consumption of inductive reactive energy: Motors, ventilation systems --> high values (far higher than Q2)
-
Q2. Delivery of inductive reactive energy: Three-phase generators such as diesel generators or wind turbines --> Lowest value of all
-
Q3: Delivery of capacitive reactive energy: Producers such as PV systems, batteries or bidirectional charging stations (However, production must already have taken place) --> High value (far higher than Q2, often also higher than Q1)
-
Q4: Consumption of capacitive reactive energy: Storage systems, inverters, compensation systems, electric vehicles, loads in apartments --> Medium to high values (far higher than Q2, often also higher than Q1)
Q1 and Q4 are difficult to assess without more detailed knowledge. In a multi-family house with a solar system, however, Q2 and Q3 can easily be assessed. If the development of Q2 and Q3 does not follow the trend of the example above, the following is probably the case:
-
At least one swapped voltage and current
-
At least one transformer with the wrong flow direction or crossed cables to the meter
Possible sources of error:
-
Installation flow direction of the transformers
-
Swapping of the transformer taps
-
Incorrect wiring on the test terminal block
-
Incorrect tapping from the test terminal block
-
Incorrect wiring on arrival at the meter (I IN / I OUT)
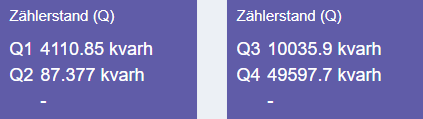
Example of a balance meter of a large multi-family house with solar system + e-mobility
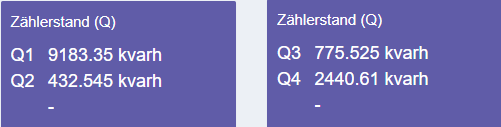
Example of a balance meter in a single-family house with solar system
8. Check the connectors and the line resistances of the transformer output
Consider this approach if the signs of the power values and currents are correct, but the current values are unnaturally low.
-
Every transformer has an output power in volt-amperes S [VA]
-
The line resistances must not be greater than what allows the maximum secondary current to flow with the available power.
Formula: max. line resistance R = S / secondary current I^2
Example: 200A / 5A transformer with 1VA output power
max. R = 1VA/(5A*5A) = 0.04 Ohm
This means the measured resistance between the positive and negative transformer connections must not be greater than 0.04 Ohm. It should also not be too tight; the AC resistance at 50Hz is slightly higher than the DC resistance.
Note:
-
The measurement must be carried out with the transformer removed!
Otherwise, the line resistance of the transformer coil is measured and not the outgoing and return lines.
What can I do if the line resistance is too high?
-
Check all connectors, retighten them and measure again.
-
Increase the cable cross-section (2.5mm2 is common)
-
Shorten the cables
-
Replace the transformer with a more powerful transformer, e.g. 5VA
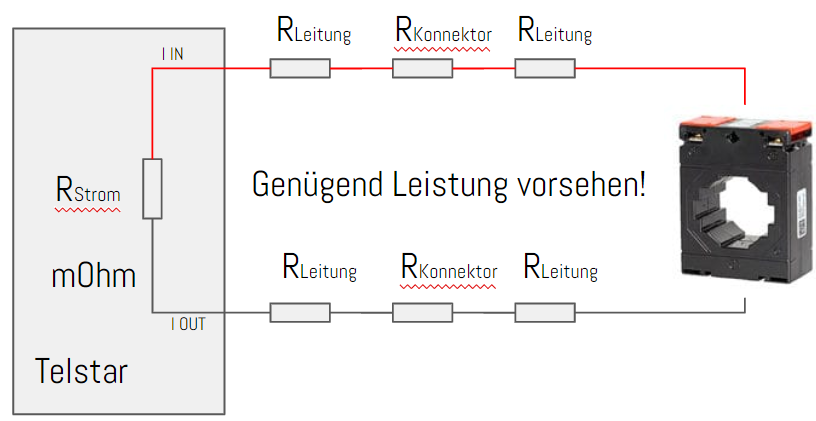
Understanding the three-phase system and the transformer-rated meter
Introduction
The following discussion is intended to shed light on the measuring behavior of a transformer-rated meter in the event of an error. It uses simple sinusoidal voltages and currents so as not to complicate the topic unnecessarily. However, it is important to know that currents almost never have a sinusoidal form and that the resulting phase shift in the event of incorrect wiring will deviate slightly from this discussion.
General
-
The three phase voltages and currents are offset in time from one another in order to generate a rotary motion in a motor.
-
The current is a consequence of the applied voltage and is determined by the behavior of the load.
The time offset mentioned above corresponds to exactly 120° of a full rotation of 360°.
-
Phase 1 starts at 0°
-
Phase 2 starts at 120°
-
Phase 3 starts at 240°
At 50 Hz, 360° = 20ms or 1/frequency = period The time shift between the individual phases is accordingly: 20 ms/360° * 120° = 6.666 ms
What does the transformer-rated meter do?
A transformer-rated meter interprets each phase voltage, each phase current and its phase power individually from the other two and sums the three resulting phase power values to a 3-phase total power.
Sum P = phase power 1 + phase power 2 + phase power 3
If individual values were negative (e.g. the current transformer of one phase has a reversed flow direction), the result is a lower power than expected.
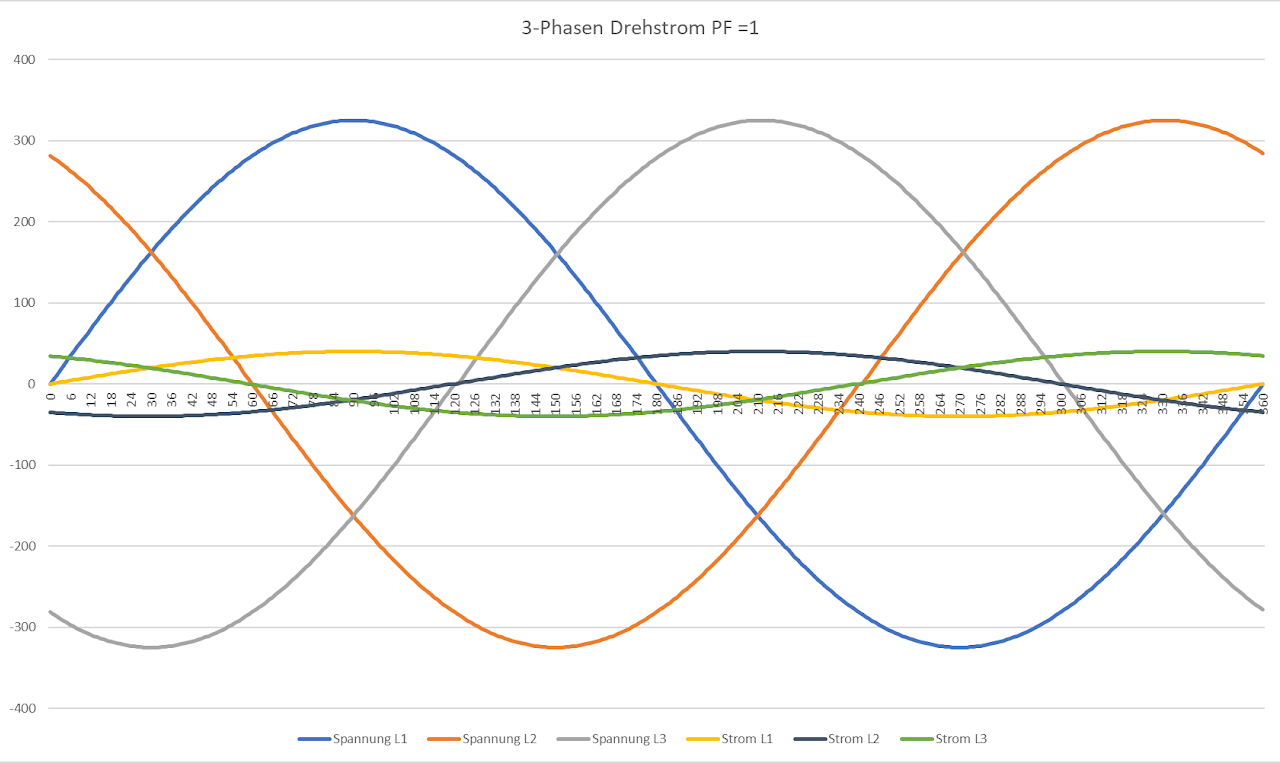
Oscilloscope view of a 3-phase system
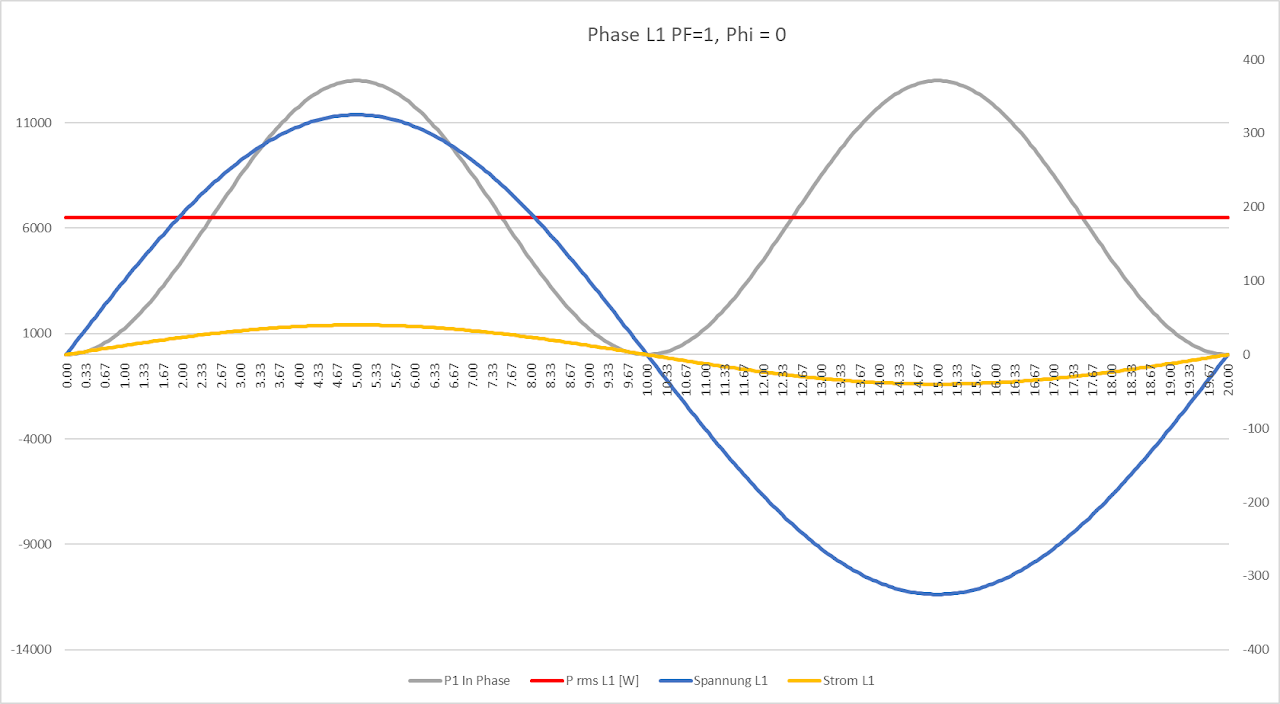
Phase voltage and phase current are connected correctly (U1 / I1)
Let us look at a correctly connected phase. The voltage L1 (U1) and the current L1 (I1) are measured (the transformer is connected in the correct flow direction).
Both half-waves result in positive power, since voltage and current have the same sign in each half-wave.
The measured power correctly corresponds to 6500W (red).
Transformer flow direction reversed on one phase
Example: solar system
The solar system produces a power of 30kW --> 10kW per phase. (Solar systems always produce as evenly as possible across the three phases) If everything is correct, these 30kW can also be read on the measuring device.
If the transformer of phase 1 has a reversed flow direction, the result is a negative phase power for phase 1.
Sum P = -10kW + 10kW + 10kW = 10kW
The total power corresponds to only 1/3 of the expected power.
Phase voltage and phase currents have been swapped
Note: If a phase current or phase voltage was connected to the wrong input of the meter, two phases are always affected at once!
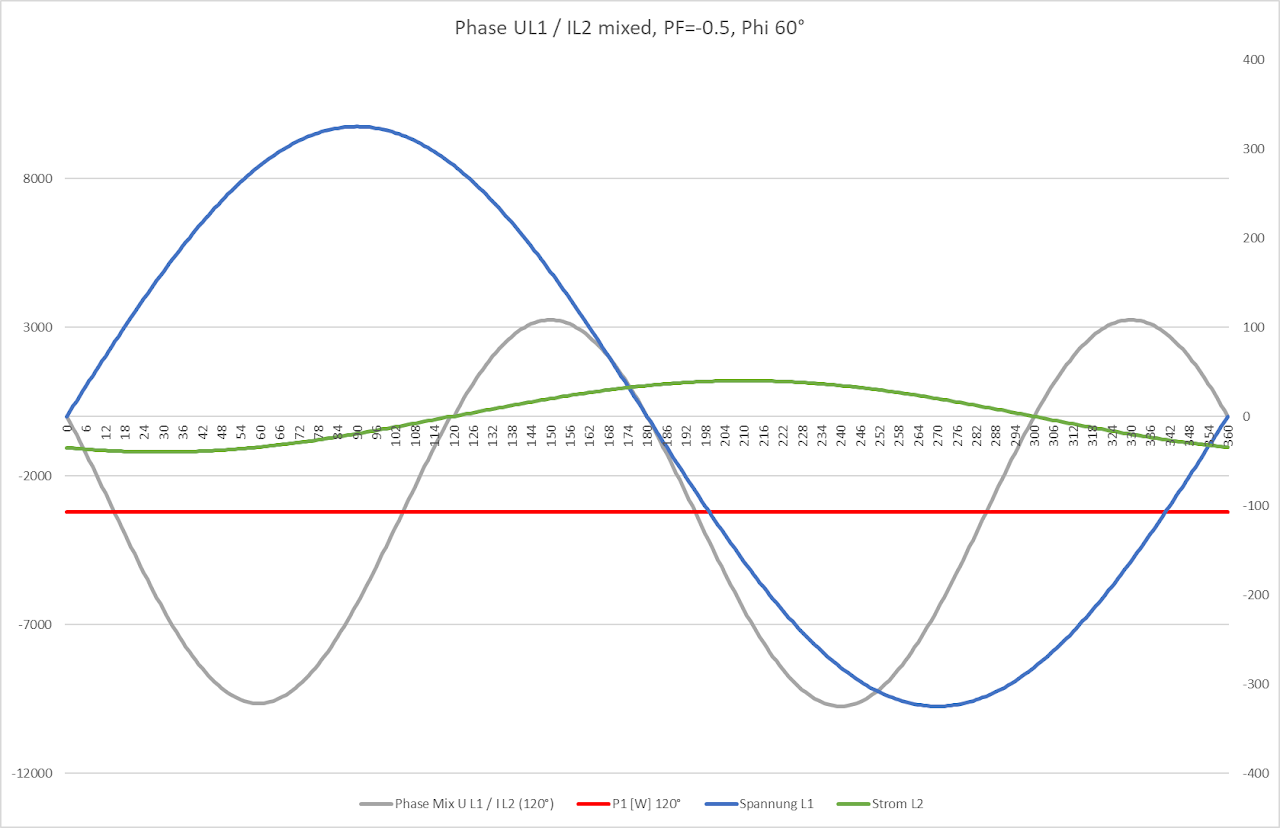
Phase voltage and phase current have been swapped (U1 / I2) and are measured on phase 1
Let us look at the result of a measurement when the meter is supplied with the correct voltage L1 (U1) but the wrong current L2 (I2).
So we are mixing the voltage of phase 1 with the current of phase 2.
The phase power becomes negative. The phase shift of 120° results in a measured phase shift of only 60° in the measuring device and is now displayed with a power factor of 0.5.
Result: negative power, half of the expected 6500 W)
P = -3250W (red)
Note: It must be taken into account here that in a real system the power factor may be higher or lower than 0.5 (e.g. 0.3 to 0.7). This is because the power factor on phase 1 is already between 0.8 and 1, even with correct wiring and measurement.
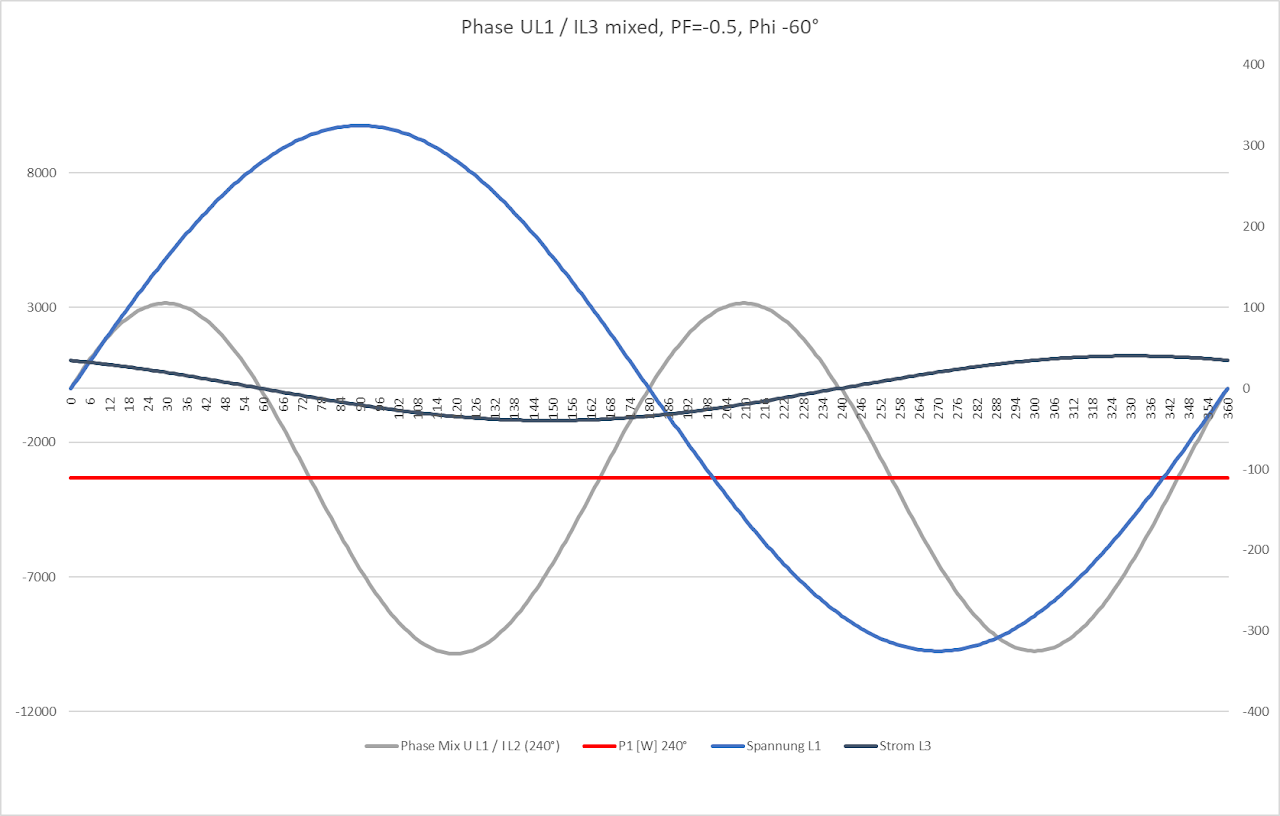
Phase voltage and phase current have been swapped (U1 / I3)
Let us look at the result of a measurement when the meter is supplied with the correct voltage but the wrong current.
We are mixing the voltage of phase 1 with the current of phase 3.
The phase power becomes negative. The phase shift of 120° results in a measured phase shift of only -60° in the measuring device and is now displayed with a power factor of 0.5. (The power factor in the measuring device can only take values from 0 to 1, even though cos (phi) = -0.5 would now be correct)
Result: negative power, half of the expected 6500 W)
P = -3250W (red)
Note: It must be taken into account here that in a real system the power factor may be higher or lower than 0.5 (e.g. 0.3 to 0.7). This is because the power factor on phase 1 is already between 0.8 and 1, even with correct wiring and measurement.