Visualization and Public Links
Prerequisite
You need a smart-me Limited or Professional subscription to use this function.
Configuring visualizations
A visualization is created on a folder. When you click on the folder in the app or on the web, the corresponding visualization is displayed.
Creating visualizations
To create a visualization, proceed as follows:
-
Log in to the smart-me website.
-
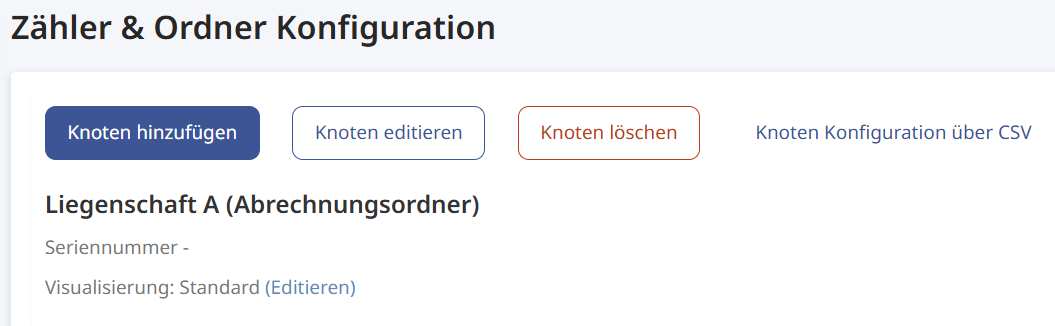
Click on Meter & Folder Configuration (Zähler / Ordner Konfiguration).
-
Select the folder on which the visualization is to be created.
-
Next to Visualization (Visualisierung), click on edit (editieren).
-
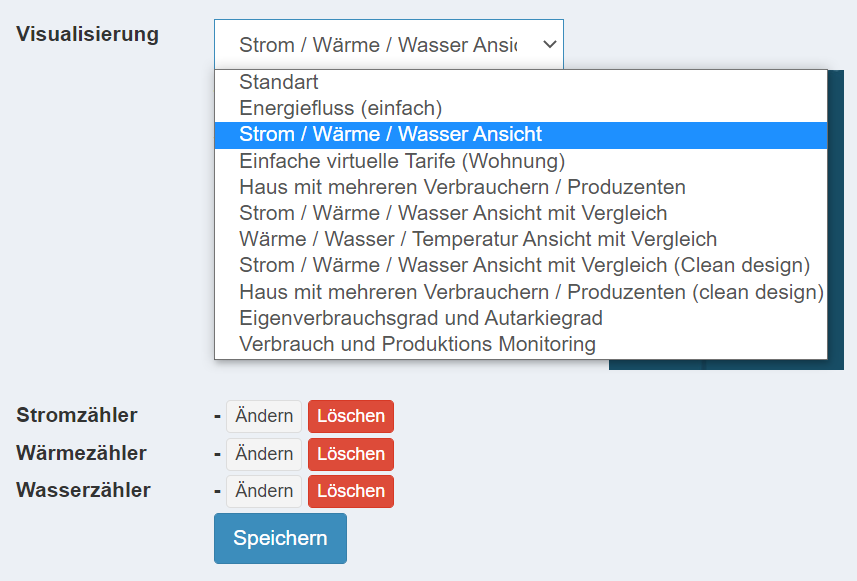
Select the desired visualization and add the corresponding meters.
View for tenants
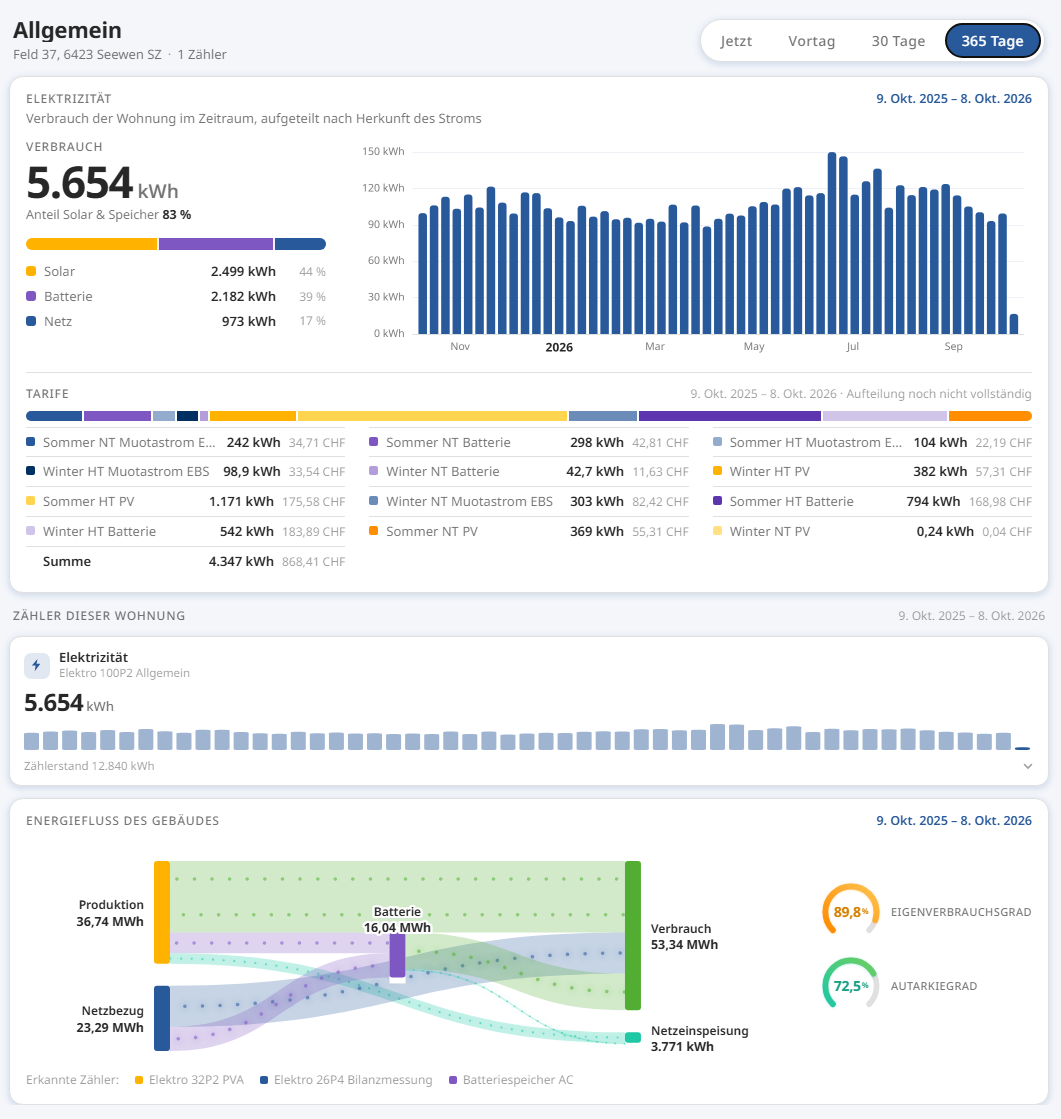
A special view for tenants is available for the virtual tariffs. It shows the current energy consumption (electricity) and its source (solar or grid). In addition, the bar shows the past source of electricity consumption.
This must also be configured for each apartment node.
The visualization is called: "Simple virtual tariffs apartment" ("Einfache virtuelle Tarife Wohnung")
Attention: Here you must select the relevant folder of the apartment, not the meters it contains!
Optional: Energy flow of the building
The energy flow of the building can optionally be visualized.
-
To do this, the tenant must also be given access to the balance, production and battery metering points. The reference meters are selected automatically based on their names.
For example, add the user account to the technical meters folder that contains the metering points mentioned.
Automatic name recognition details
Deutsch
Bilanzzähler: Bilan… (Bilanz, Bilanzmessung) · Netz… (Netzbezug, Netzanschluss) · Bezug · Einspeis… · Hauptz… (Hauptzähler) · HAK · Anschluss (auch Hausanschluss) · Zählpunkt / Zaehlpunkt · Messpunkt · Übergabe / Uebergabe · Transformat… (Transformator) · Trafo Solarzähler: Solar… (Solar, Solaranlage) · PV · PVA · Photovolta… (Photovoltaik) · Fotovolta… · Produktion Batteriezähler: Batteri… (Batterie) · Akkumul… (Akkumulator) · Akku · Speicher · Powerwall
English
Balance meter (grid): Balance · Grid · Mains · Connection · Injection · Transformat… (Transformer) · Trafo Solar meter: Solar… (Solar) · PV · PVA · Photovolta… (Photovoltaic) · Production Battery meter: Battery · Storage · Accumul… (Accumulator) · Powerwall
Français
Compteur de bilan (réseau) : Bilan… (Bilan) · Réseau / Reseau · Soutirage · Injection · Raccordement · Point de mesure / de raccordement / de livraison · Transformat… (Transformateur) · Trafo Compteur solaire : Solair… (Solaire, solaires) · PV · PVA · Photovolta… (Photovoltaïque) · Production Compteur de batterie : Batteri… (Batterie) · Stockage · Accumul… (Accumulateur) · Powerwall
Italiano
Contatore di bilancio (rete): Bilan… (Bilancio) · Rete · Prelievo · Immissione · Allacciamento · Punto di misura / di consegna / di prelievo · Trasformat… (Trasformatore) · Trafo Contatore solare: Solar… (Solare) · PV · PVA · Fotovolta… (Fotovoltaico) · Produzione Contatore batteria: Batteri… (Batteria) · Accumul… (Accumulatore) · Powerwall
Hrvatski / Srpski / Bosanski
Bilančno brojilo (mreža): Bilan… (Bilans) · Mreža / Mreza · Priključak / Prikljucak · Merno mesto / Mjerno mjesto · Transformat… (Transformator) · Trafo Solarno brojilo: Solar… (Solarni) · PV · PVA · Fotonapon… · Proizvodnja Brojilo baterije: Bateri… (Baterija) · Akumul… (Akumulator) · Skladište / Skladiste · Powerwall
Various visualizations for the entire property
This is an overview of various possible visualizations. The list is not exhaustive.
Empty nodes can be created in order to create as many visualizations as desired.
Visualizations for ZEV
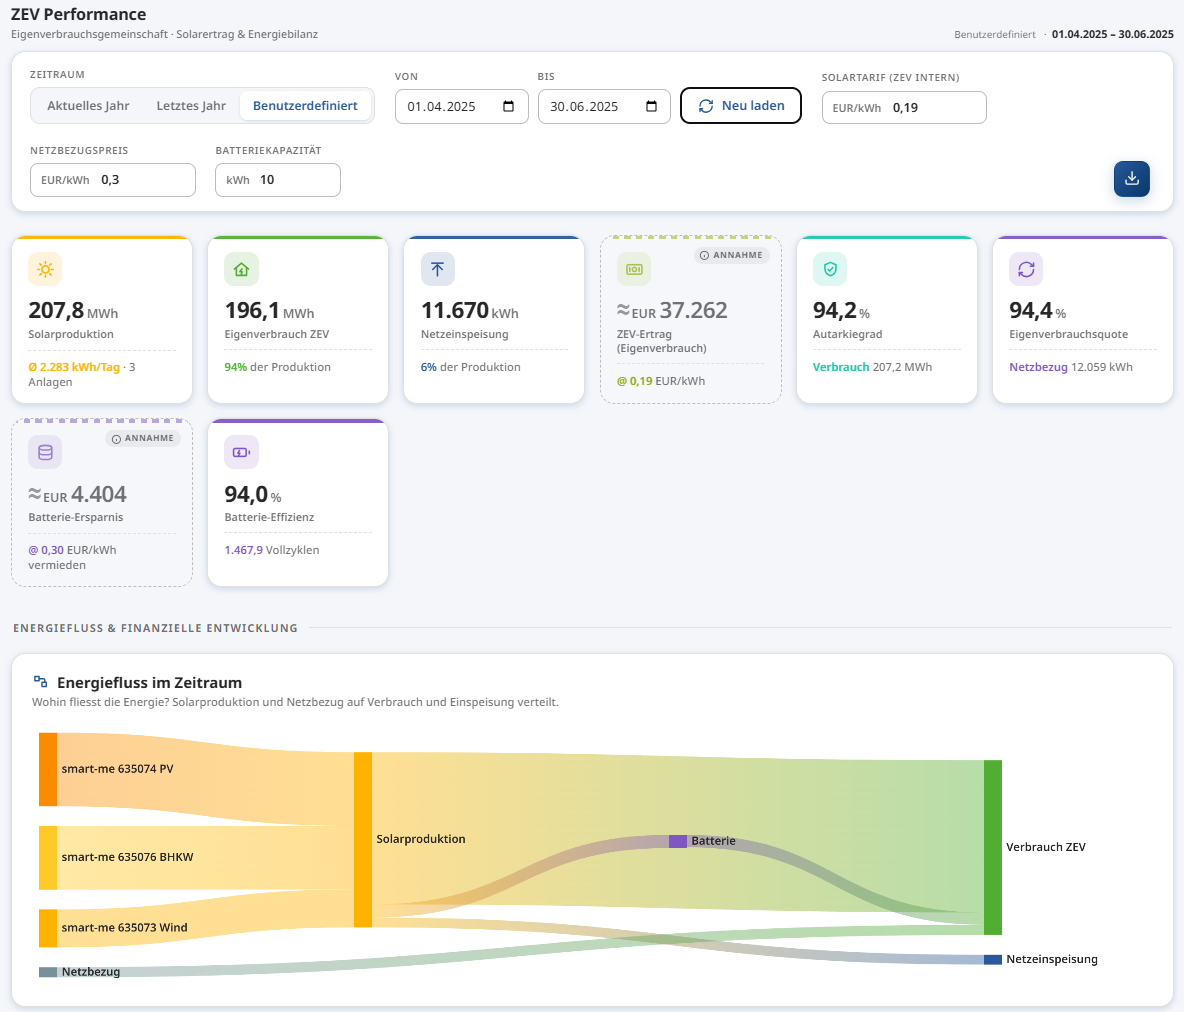
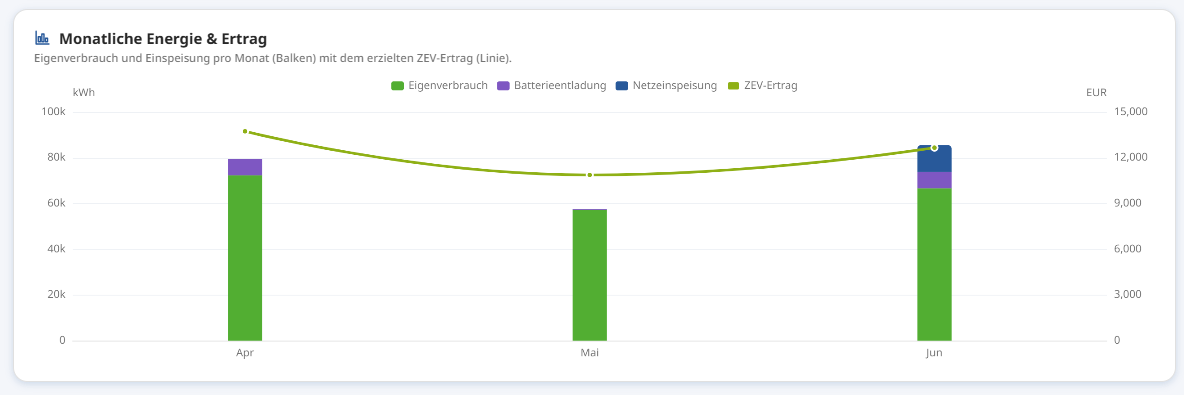
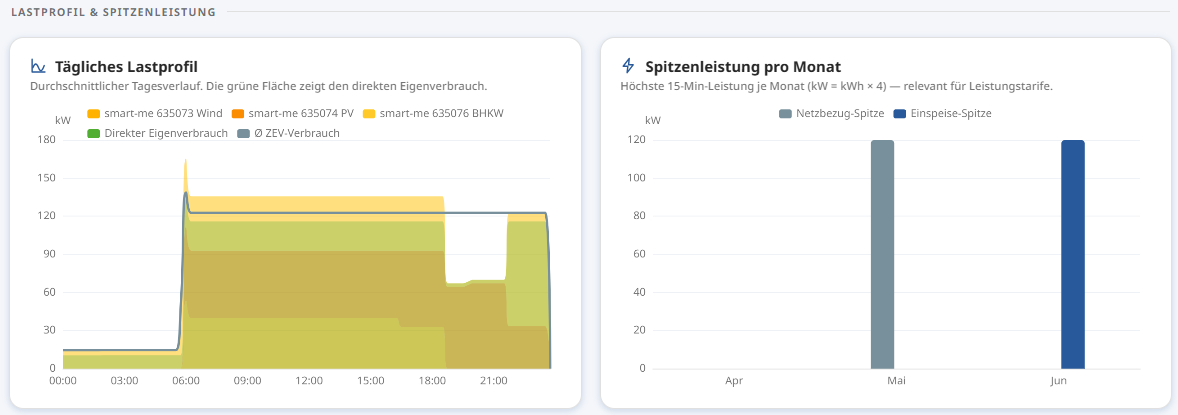
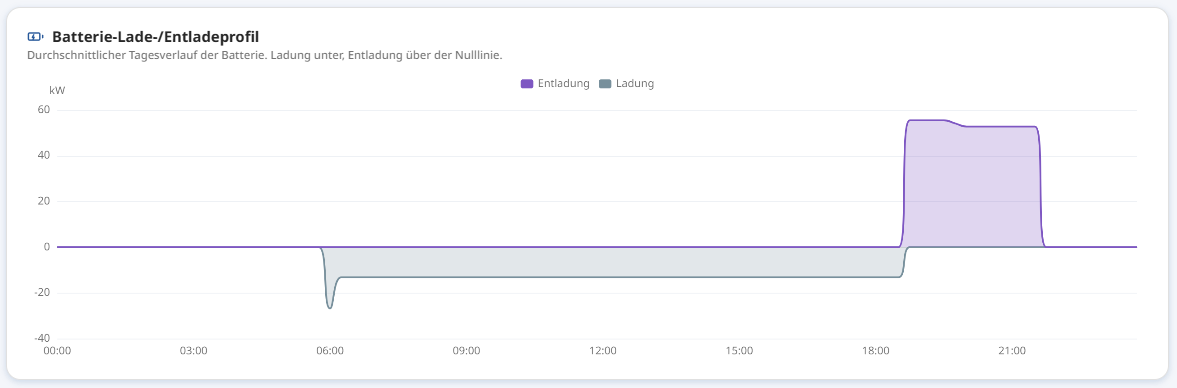
ZEV performance overview
All relevant data on your ZEV (association for own consumption) at a glance:
-
Production and yield overview
-
Peak power
-
Battery
-
Energy flow graphics
-
Solar heat map
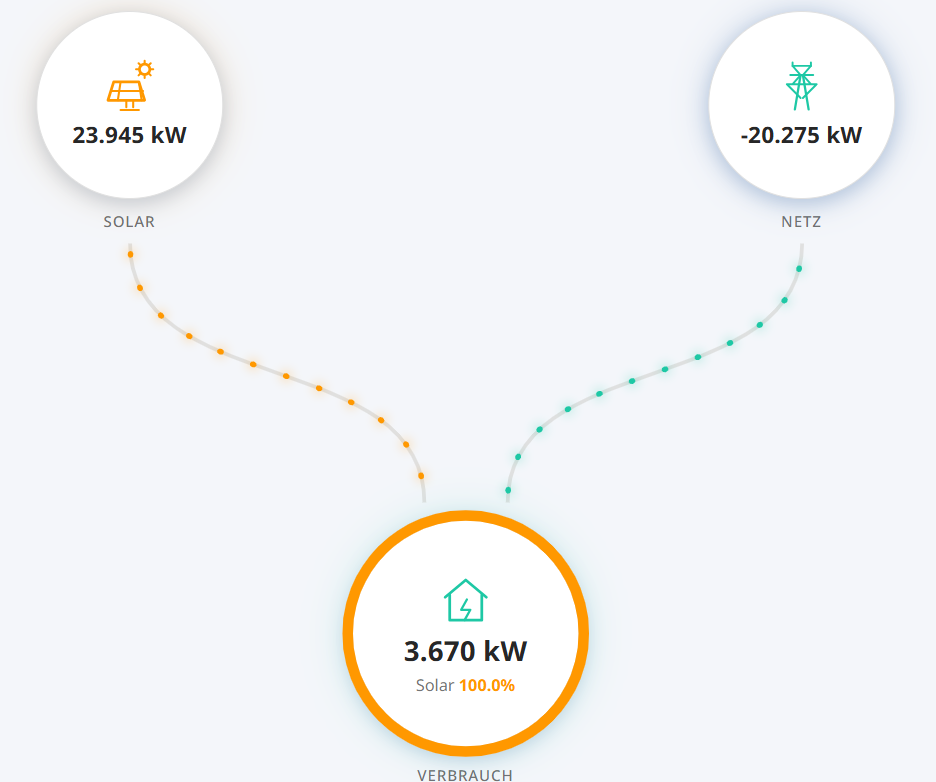
Simple energy flow
Shows the energy flow for a solar installation, grid consumption and household consumption.
Two of these three meters must be specified; the third is calculated automatically. If all three meters are specified, incorrect values may be displayed. We always recommend specifying direct measurements wherever possible rather than virtual meters.
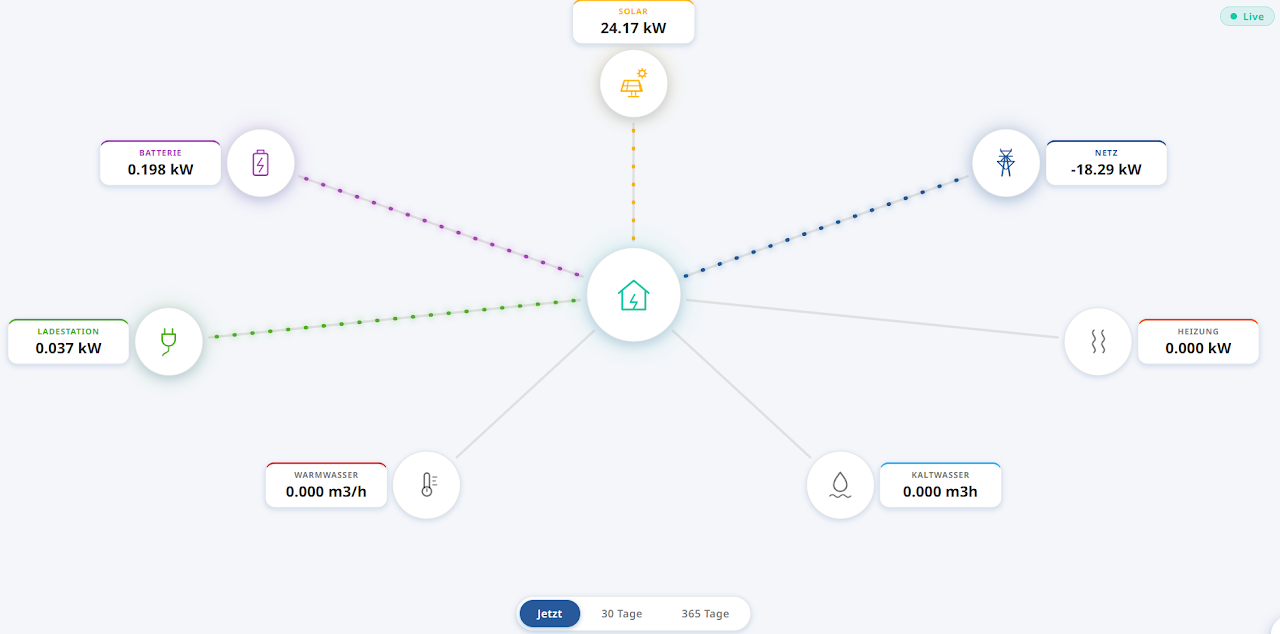
House with several consumers and producers
Up to ten consumers or producers can be visualized for a house.
Either the power values (now) or the consumption values of the last 30 or 365 days can be displayed.
Visualizations for ZEV and vZEV
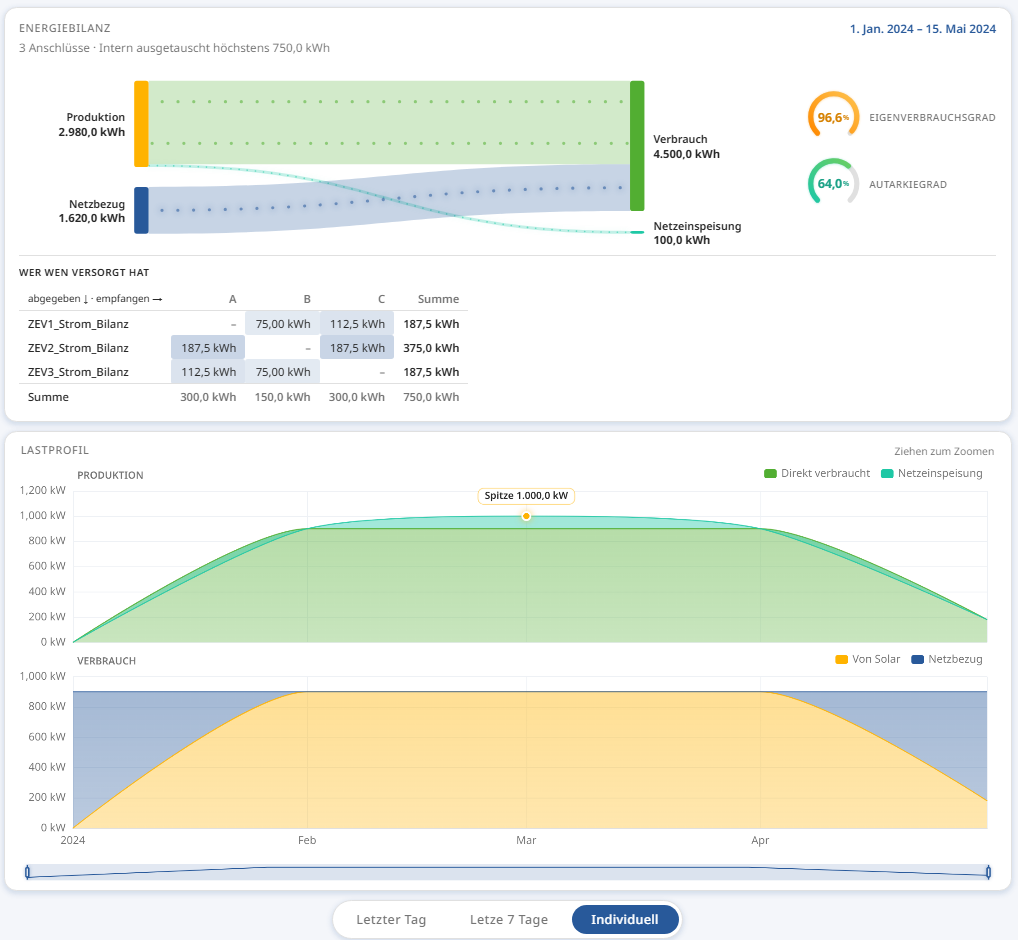
Consumption and production monitoring
Shows where the energy produced is consumed
ZEV (association for own consumption):
-
Local consumption in the house
-
Fed into the grid
For this, the production plant and the building connection meter (physical) must be defined.
vZEV (virtual ZEV):
-
Local consumption
-
Supplied to neighbours
-
Fed into the grid
For this, the production plants of the vZEV and the building connection meters (physical) of the vZEV participants must be defined.
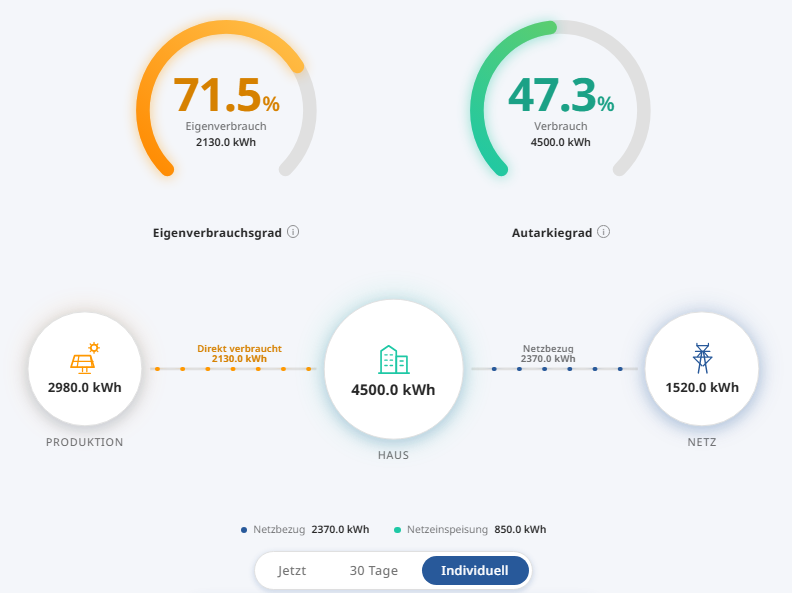
Self-consumption rate and self-sufficiency rate
The self-consumption rate and self-sufficiency rate of a building are displayed. The values are calculated from the PV meters and the balance meter(s).
Self-consumption rate: How much of the solar energy is consumed directly in the house.
Self-sufficiency rate: How much of the total consumption is produced by the solar installation.
Attention: The main meter must not be a virtual meter!
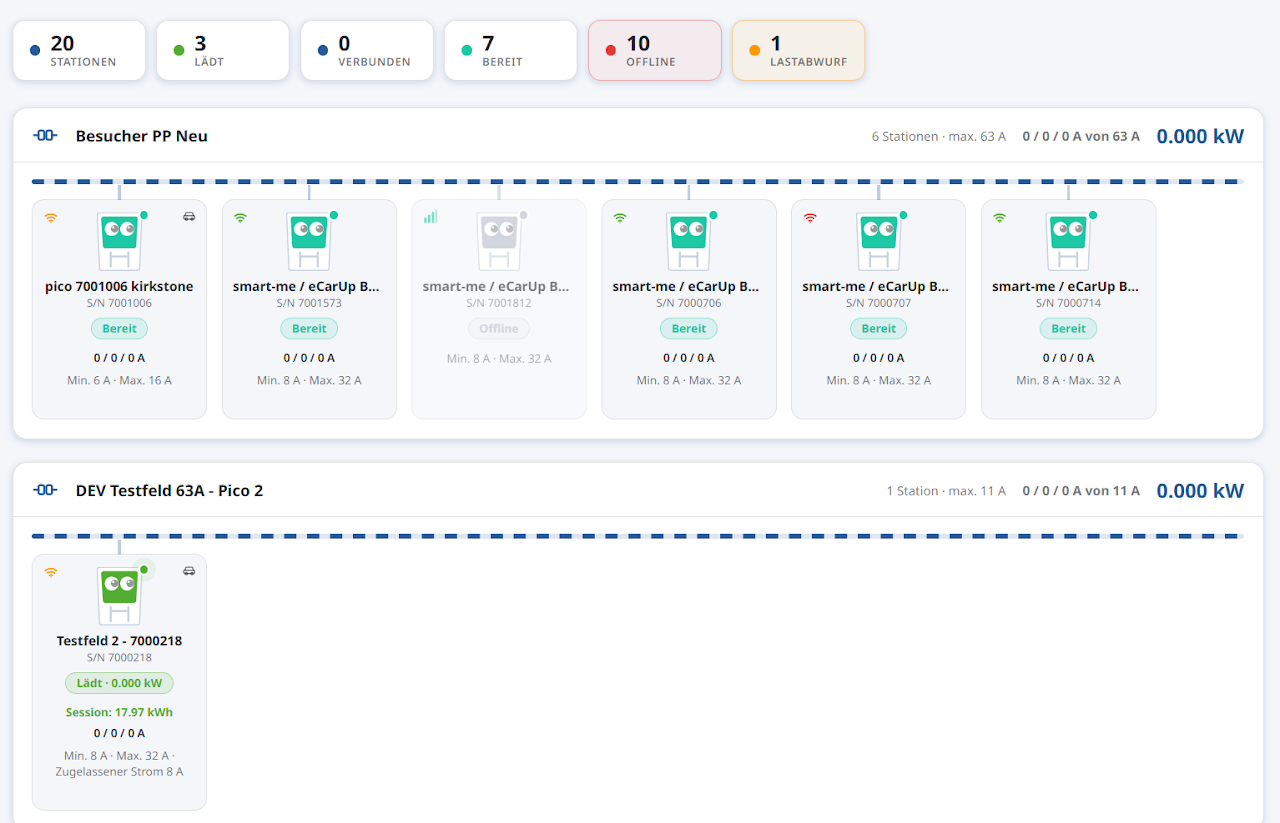
Pico group monitoring
All relevant data on your charging stations at a glance:
-
Occupied / Charging / Available
-
Load management and released currents
-
Online status
-
Load shedding activity
Special visualizations
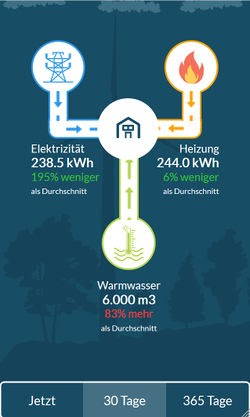
Consumption of an apartment compared to a reference apartment
The current power values of an apartment (electricity, heat and water) are displayed.
For the historical consumption values, a comparison with a reference apartment is also displayed (e.g. "10% less electricity consumed than the average").
Further options (optional)
Finally, you can now activate interfaces or implement controls.
To do this, navigate in the main wiki menu (top) to:
Configuration or Interfaces.
Public Links
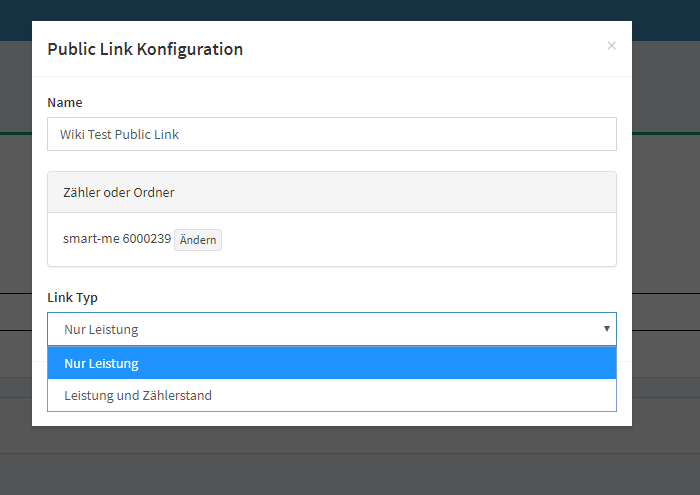
With the smart-me Limited or Professional subscription, you can use a Public Link to display the power and/or the meter reading of any metering point or folder in your smart-me metering infrastructure in real time on a website of your choice.
To do this, click on Configuration (Konfiguration) at the top right of the smart-me portal and then select the Public Links (Öffentliche Links) tile.
In the interface that now appears, you can use the Add (Hinzufügen) button to define the name of your Public Link and select the desired metering point and display format. The HTML code for embedding on the website of your choice is then generated for you. Insert it using copy and paste.