Microsoft Excel
Microsoft Excel can import data directly from our cloud. This lets you, for example, combine data from different accounts in one database, then read and process it. Excel uses the Power Query Editor for this. With it, you can send HTTP requests to our API. You can find the available API commands and a test environment here.
Download sample file
The file on the right contains a variable query of a meter's meter readings. You can add more meters to this file.
All required functions are available in Excel 0365 or Excel 2016 and later.
To use the sample file, download it and ..
-
Download the file
-
Update the query login data according to the information in the "Dashboard" sheet.
API_Test_ValuesInPast_Example.xlsx
Creating the connection
Creating a data query from the web
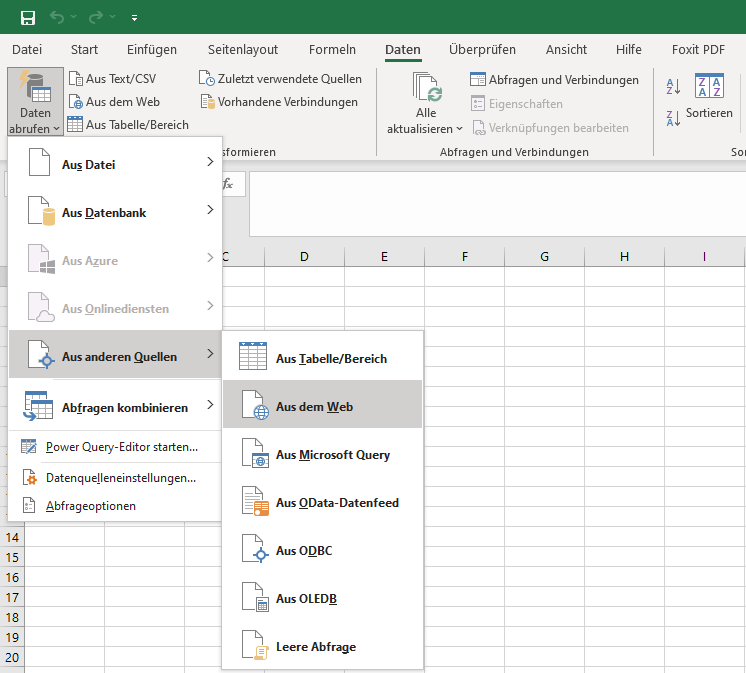
Start Excel and, on the Data tab, click Get Data, From Other Sources, From Web.
Entering the API command
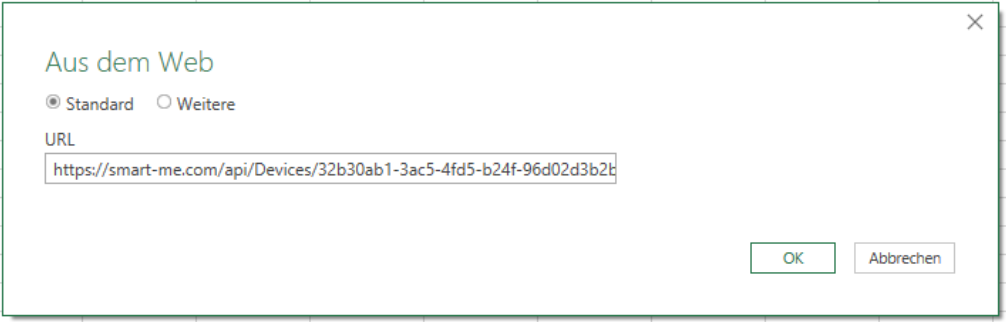
Paste the link of the API command you want to query. In the example, this is the command https://www.smart-me.com/api/Devices/{id} . So we want to read all current data of the device with the given ID.
You can find more information about the command itself in the test tool at the link above. There you can also look up the ID of the device you want.
Authentication for the link (password and username)
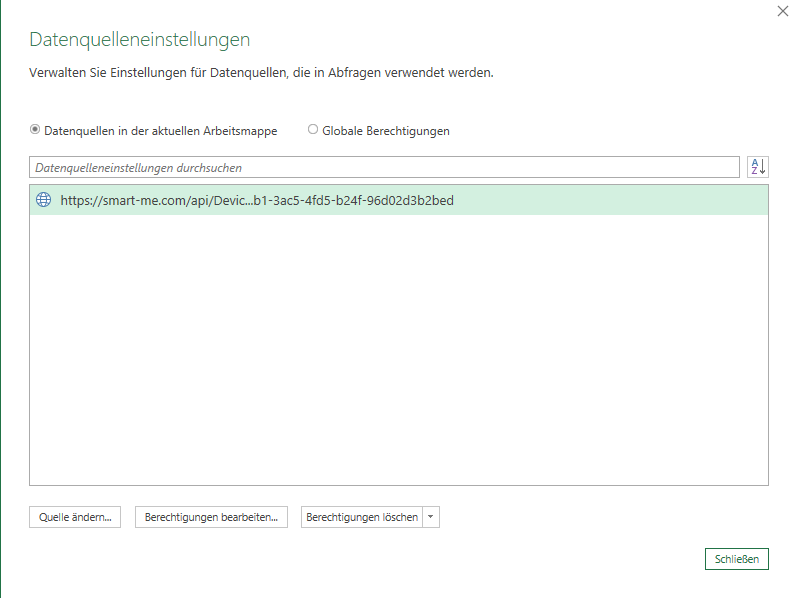
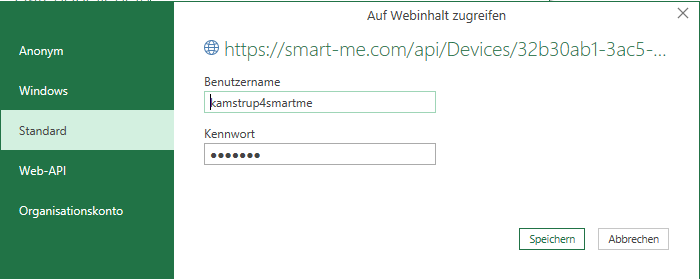
You are now prompted to enter the authentication for the link. You need the username and password of the corresponding account.
-
Select the corresponding link
-
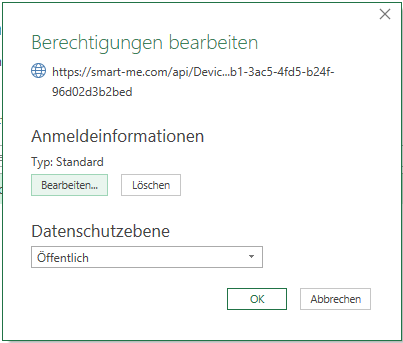
Click Edit Permissions
-
Under Credentials, click Edit
-
Enter the username and password of the account in the "Basic" tab
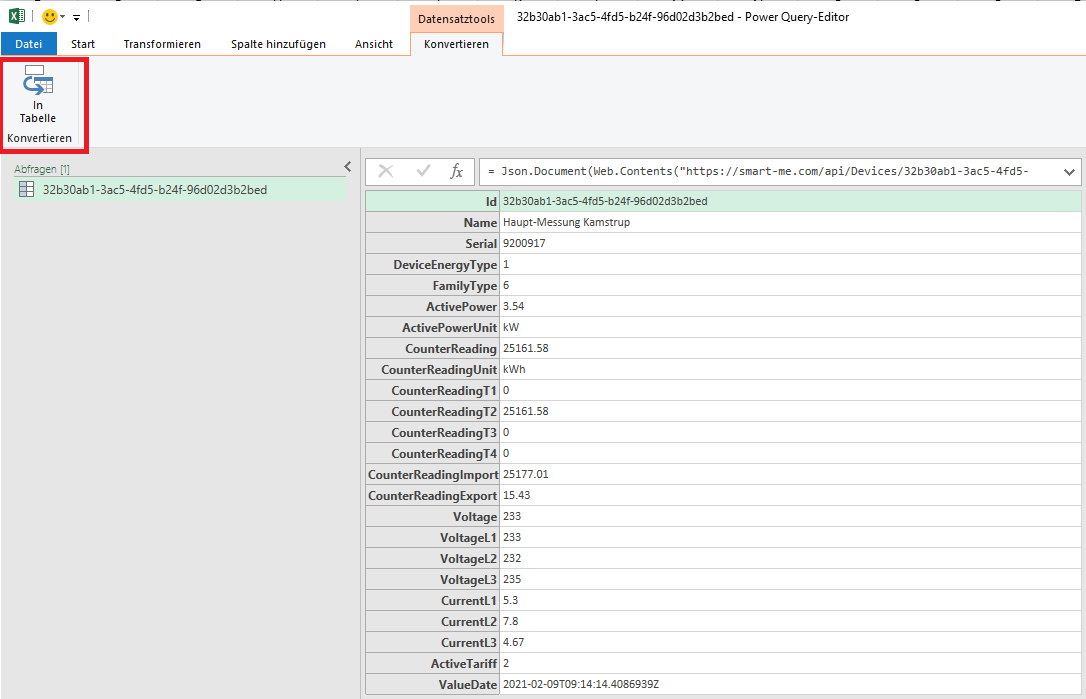
Converting the data into a table in the Power Query Editor
After the import, the Power Query Editor shows a list of the imported data. This data must now be converted into a table.
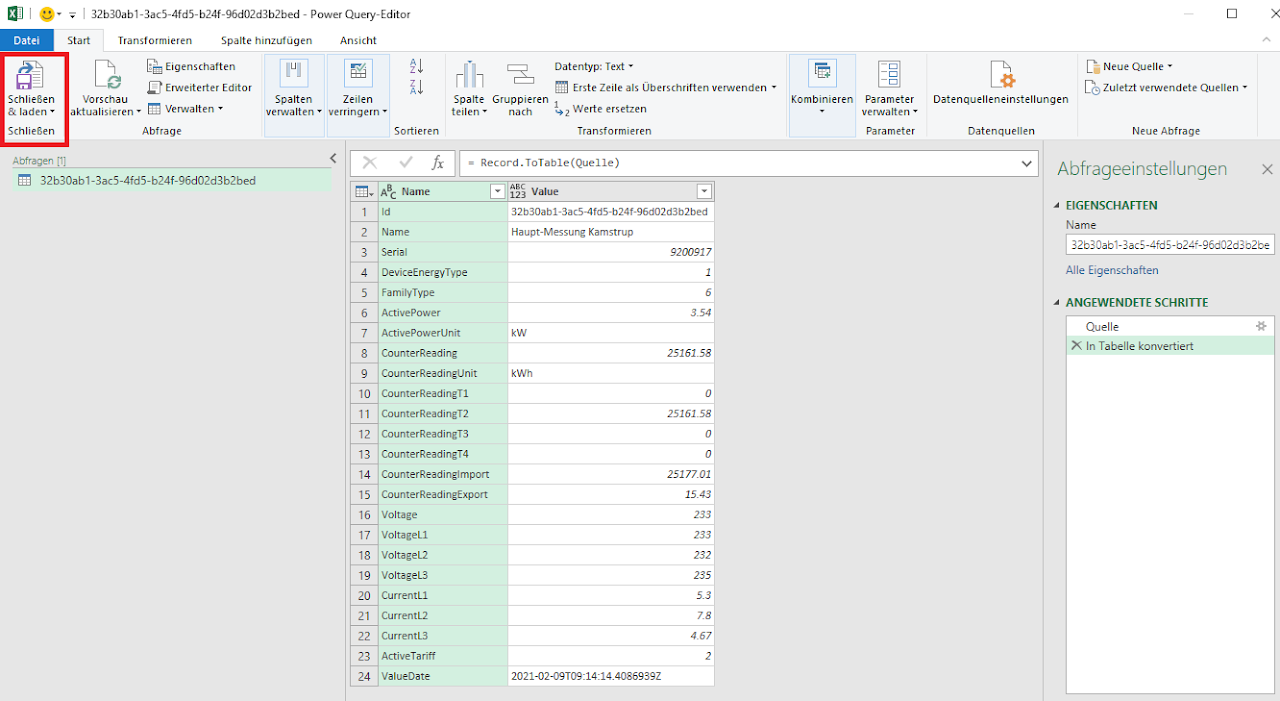
Close & Load
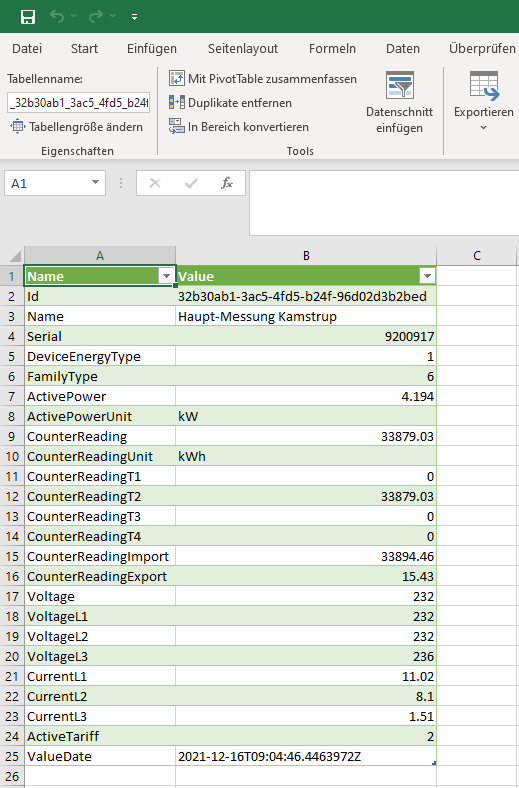
After Close & Load, a new worksheet is created containing the information from the data source.
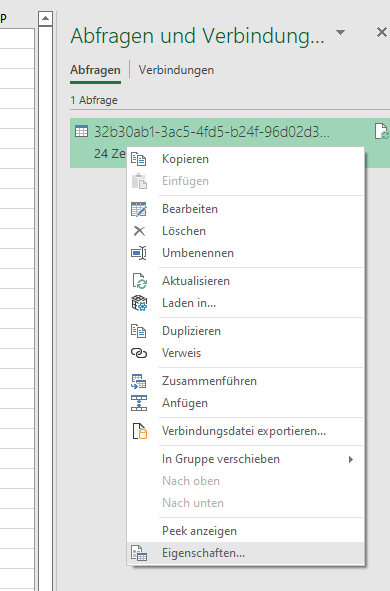
Connection query settings (interval and refresh)
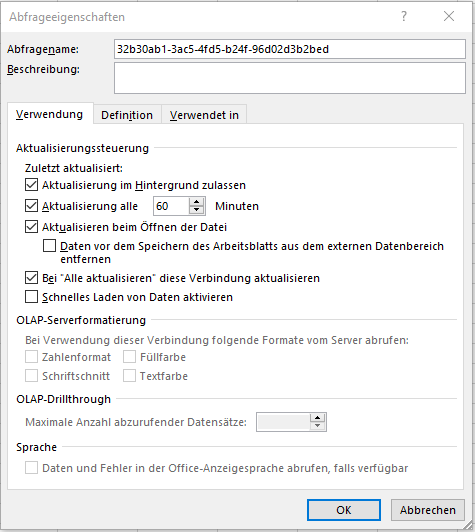
A pane opens on the right; right-clicking the existing connection there gives you further settings. Above all, you can set the refresh intervals of the connection here. On the Data tab, you can also refresh on demand.
Data query with variables (querying meter readings with a variable date)
Querying historical data follows the same principle as building the link for current data. The main difference is that the data must be queried with a changeable piece of information (a variable). To make this possible, two queries are needed:
-
A query within the Excel table for the "date" variable.
-
A query from the web with a suitable API command. The suitable command here is https://smart-me.com/api/ValuesInPast/{id} (daily meter data from the past)
Creating the date variable
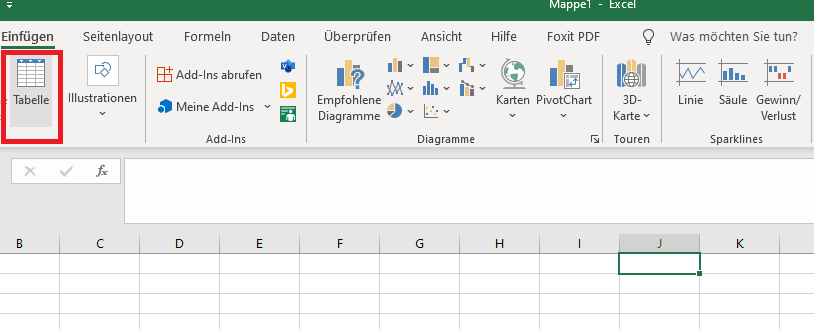
In Excel, choose a location where the date will be entered. Create a table there via Insert --> Table. (Important)

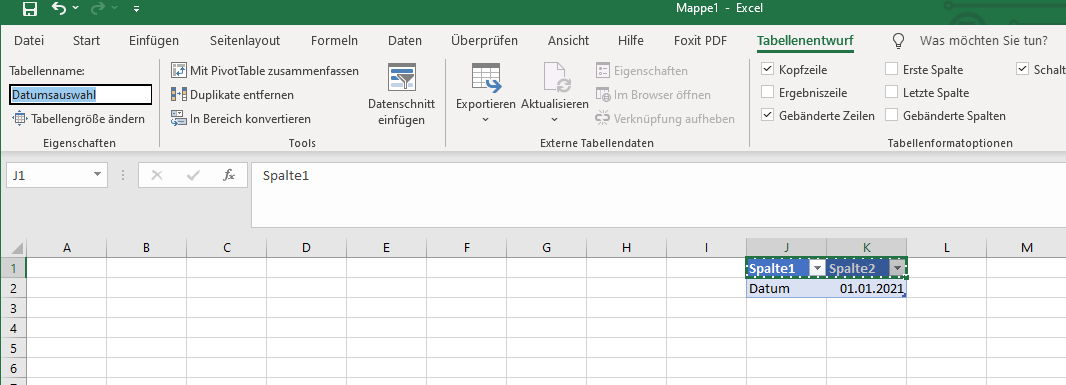
Select a range of 4 cells so that there is room for a column name and the text including the value.

Defining the table name for later programming
So that Power Query later knows which table contains the variable, the table is referenced by its name. To make this unambiguous, we assign a fixed name (here Datumsauswahl).
Formatting the variable field (text field)
So that the date can be used later, the content must be formatted as text. To do this, select the table and choose the Text format at the top.
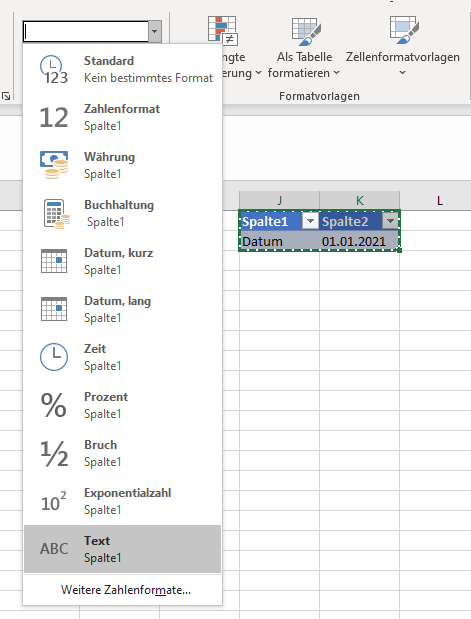
Querying the variable in Power Query
Now we can add the query for our variable in Power Query:
- Open Power Query
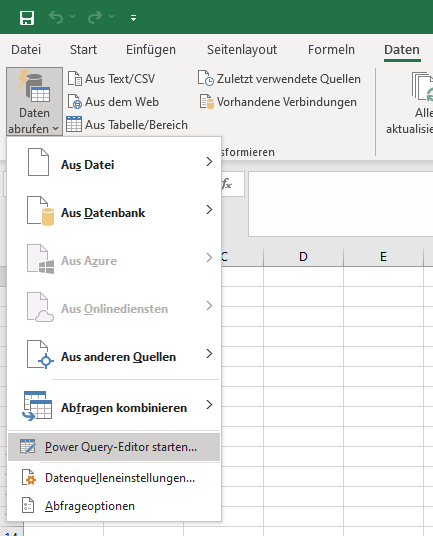
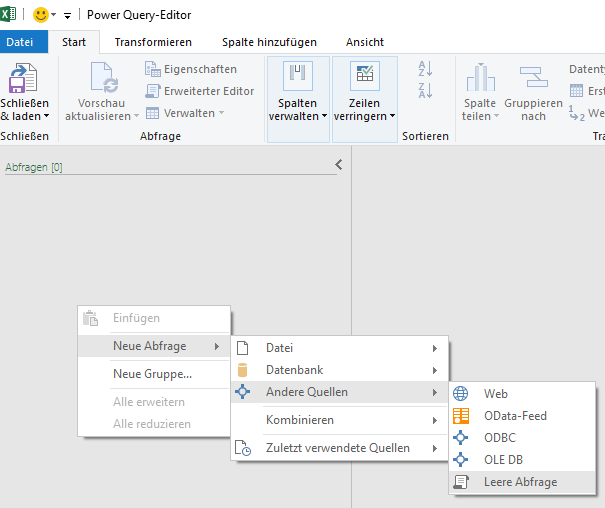
2. Create a new query in Power Query (right-click under Queries) 3. Create a Blank Query named "Datumsauswahl"
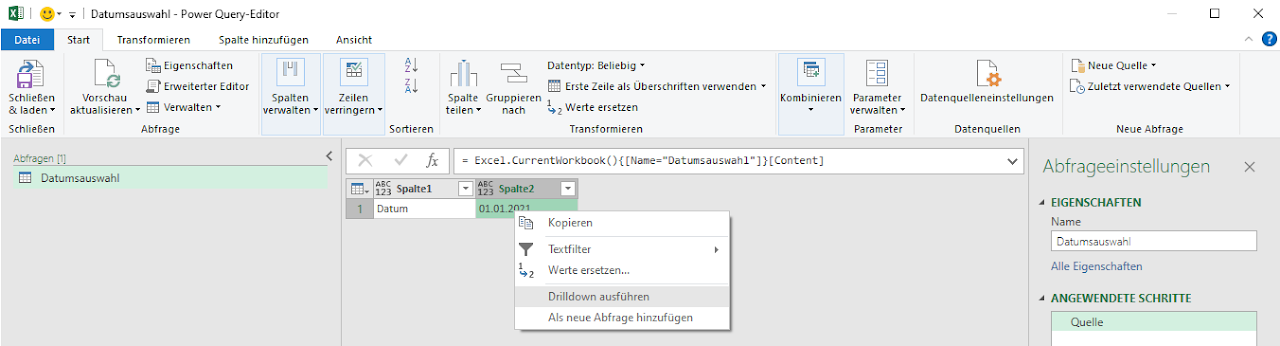
4. Copy the following text into the function bar of the query: = Excel.CurrentWorkbook(){[Name="Datumsauswahl"]}[Content] "Datumsauswahl" is the name of the table in which the value of the variable can be found.
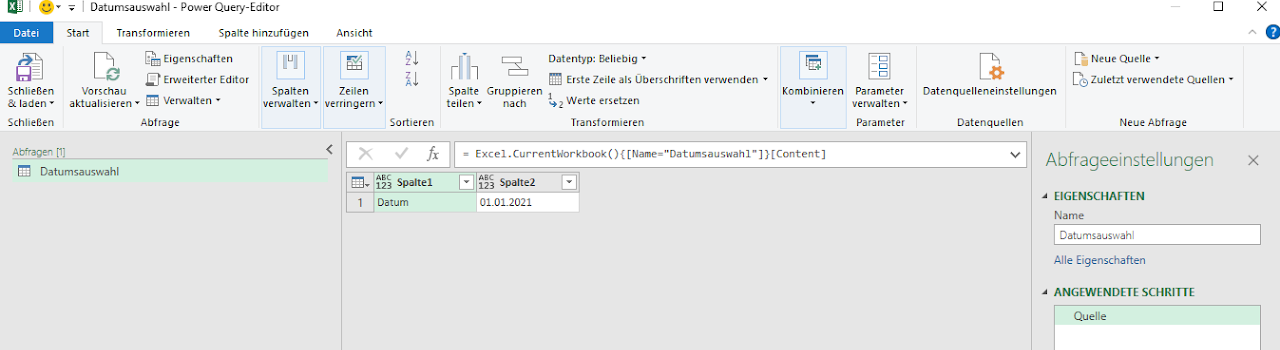
Linking the variable and the Excel value
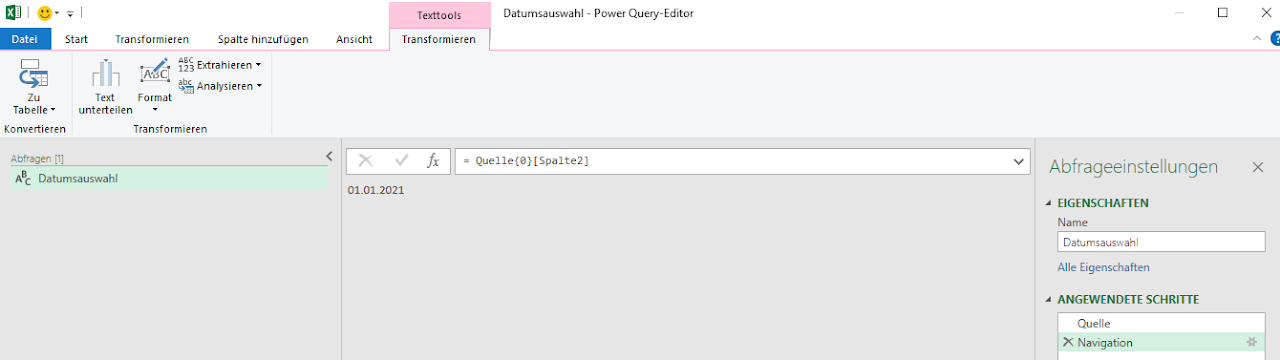
Perform a drill down to select the field that contains the changeable parameter: Select the field with the date value --> right-click --> Drill Down.
The cell content then stands on its own and from now on goes by the name "Datumsauswahl".
Creating the query for historical data
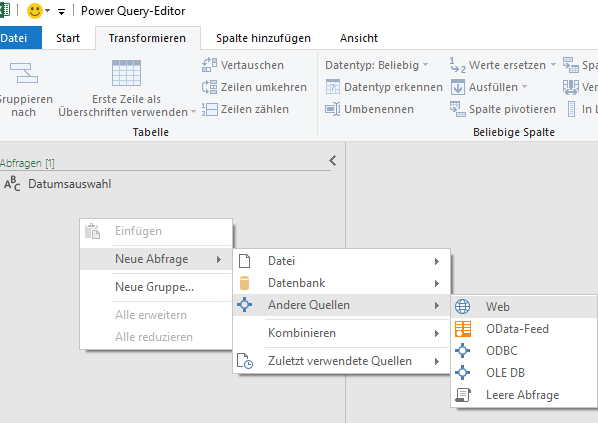
Create a new query by right-clicking the Queries pane on the left. Then choose a query from the web.
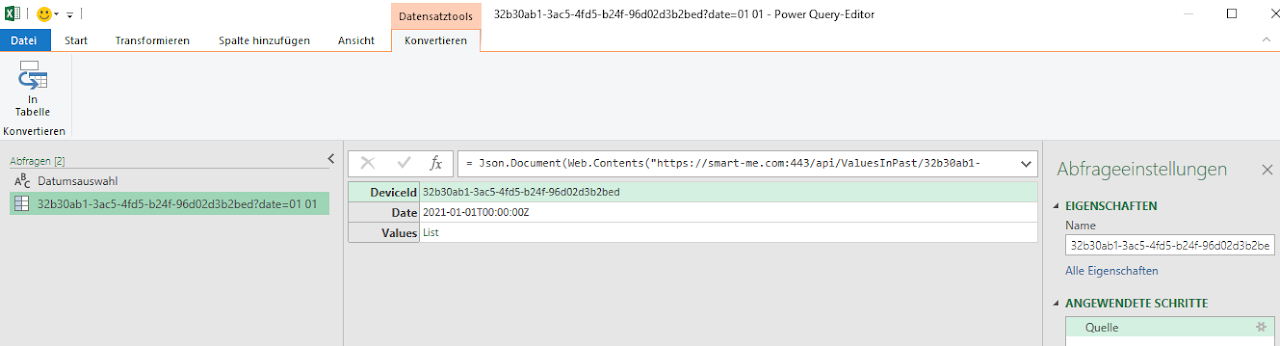
The new query now contains the command for historical data and looks like this:
https://smart-me.com:443/api/ValuesInPast/32b30ab1-3ac5-4fd5-b24f-96d02d3b2bed?date=01.01.2021
It contains the path of the HTTP request and, at the end, a target date. We will later pass this target date as a variable.
To create the query, you can pass a hard-coded value. Make sure that data already exists in the cloud for this date.
The date has the following format: month.day.year, i.e. mm.dd.yyyy

Embedding the variable in the query
To replace the fixed date with our variable, the function command needs to be adjusted slightly.
It changes from
= Json.Document(Web.Contents("https://smart-me.com:443/api/ValuesInPast/32b30ab1-3ac5-4fd5-b24f-96d02d3b2bed?date=01.01.2021))
to
= Json.Document(Web.Contents("https://smart-me.com:443/api/ValuesInPast/32b30ab1-3ac5-4fd5-b24f-96d02d3b2bed?date="&Datumsauswahl))
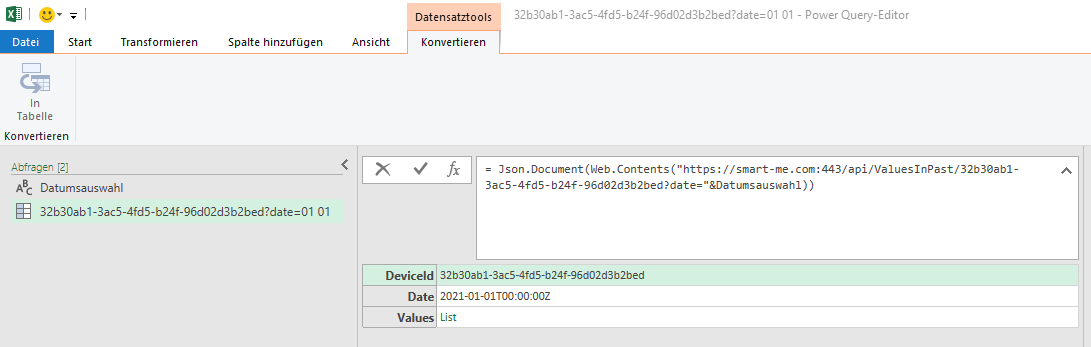
Adapting the table content to your needs
You can now restructure the displayed content within the data set and adapt it to your needs.
In our example, we would like all data to include DeviceId, date, OBIS code and value.
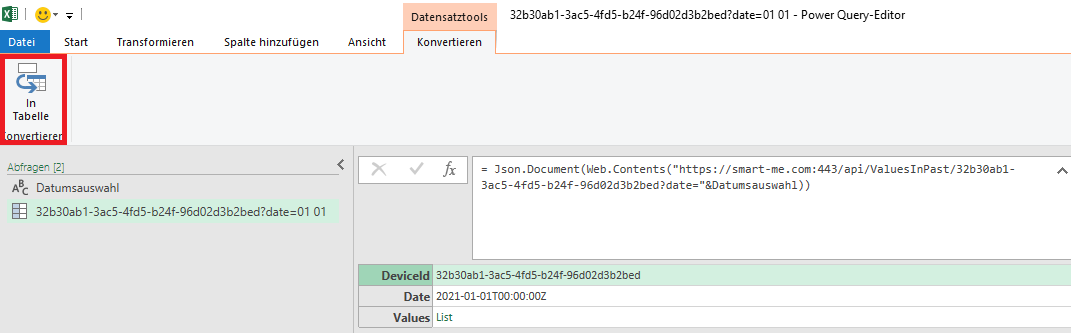
- Convert the content into a table
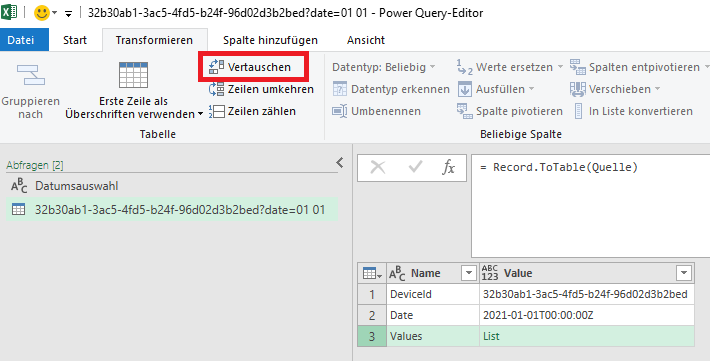
- Transpose rows and columns
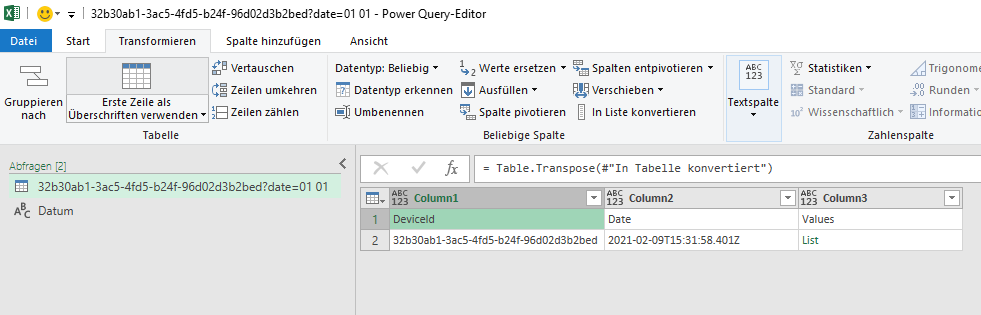
3. Use First Row as Headers
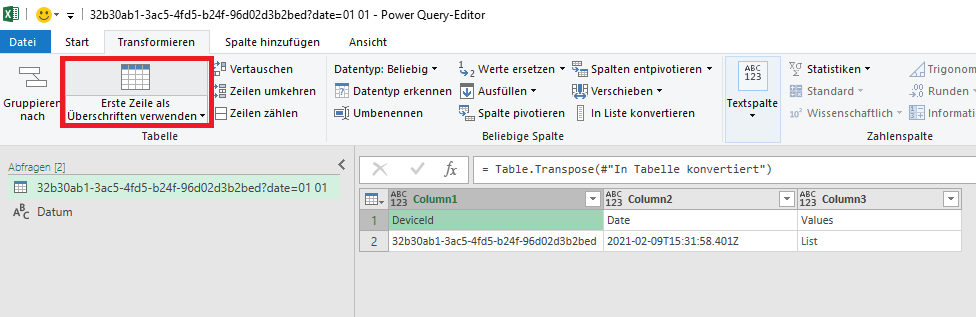
4. Edit the Values column and Expand to New Rows
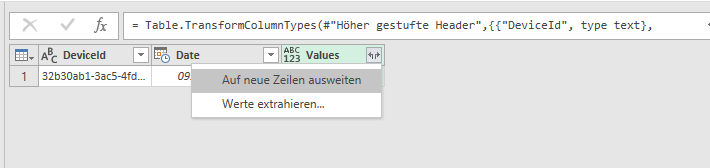
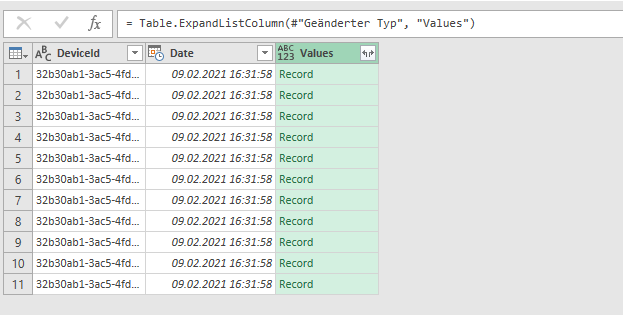
5. Select additional row contents --> OK.
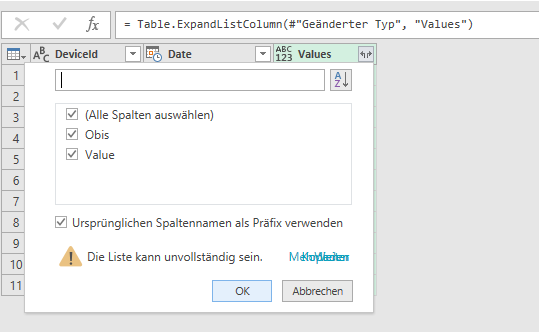
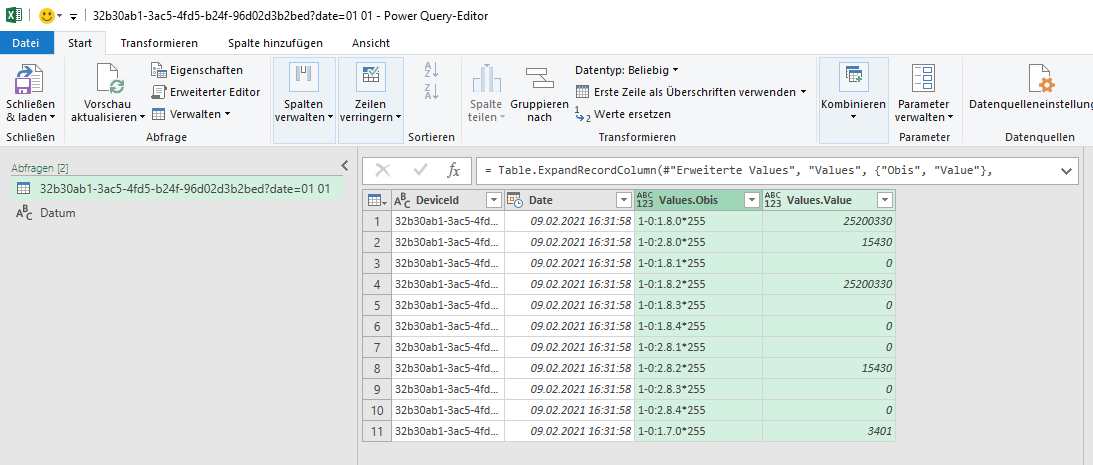
6. Click Close & Load
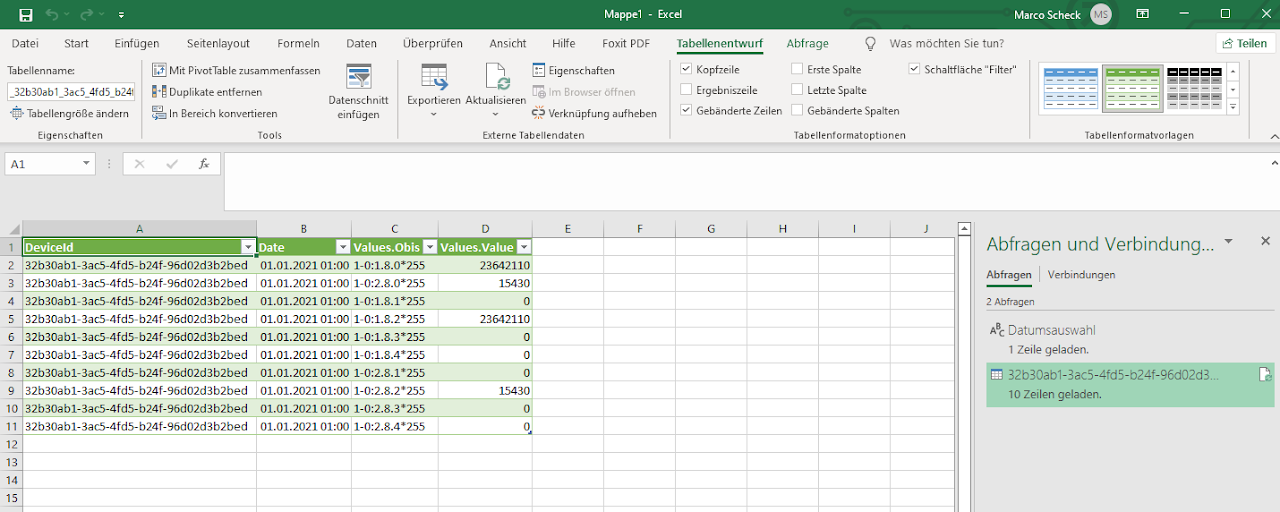
Interpreting and assigning OBIS codes
OBIS codes are standardized. To assign them, you can match the data against the Excel list of OBIS codes using VLOOKUP. This gives you the name of the OBIS code and the unit of the values.